You're probably dealing with this already. A formulation changes by a few parts. Viscosity moves, cure behavior shifts, tensile performance improves, and color stability gets worse. You adjust temperature to recover one property, then a different failure mode appears. After a few rounds, the lab notebook is full, the spreadsheet is messy, and the team still can't say which variables matter most.
That's the point where one-factor-at-a-time thinking starts to break down. In polymer and chemical R&D, inputs rarely act alone, and outputs almost never move independently. Monomer ratio, catalyst loading, shear, residence time, additive package, drying conditions, and test environment can all interact. If you study each variable in isolation, you often miss the structure of the system.
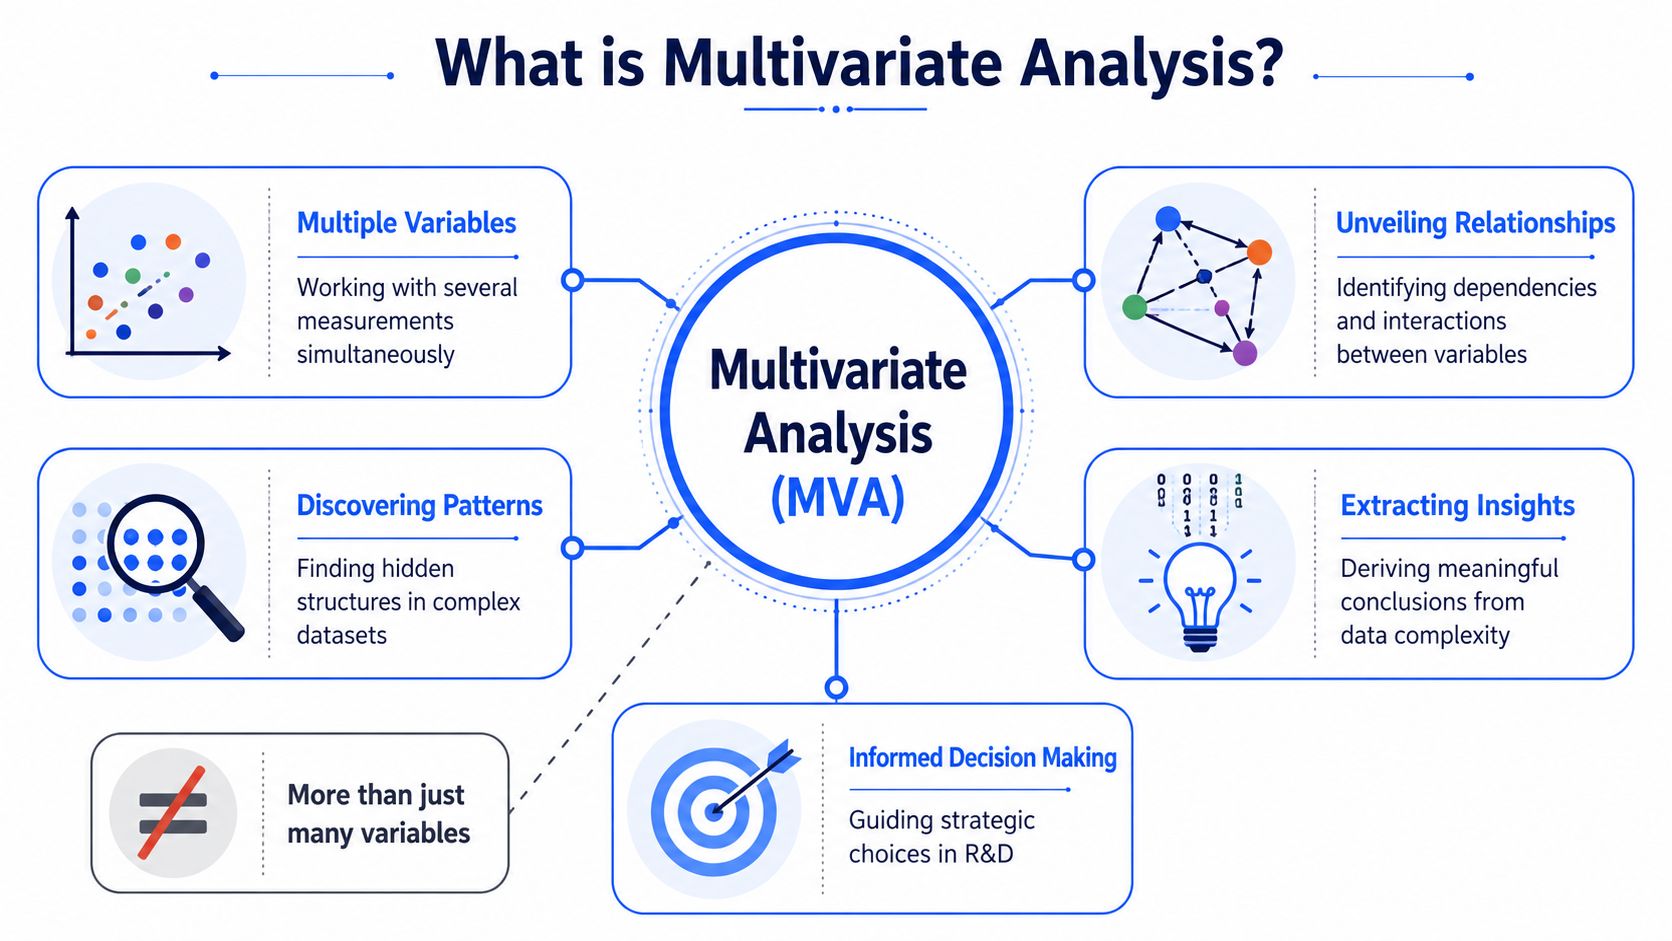
What is multivariate analysis? In practical terms, it's the set of statistical methods that lets you study several variables together so you can understand patterns, relationships, tradeoffs, and prediction in a way that matches how real materials behave. For chemists, that makes it less of a statistics topic and more of an R&D operating system. And when AI is layered on top, it becomes the engine for choosing smarter experiments instead of just analyzing completed ones.
Table of Contents
- From Trial and Error to Targeted Discovery
- Why isolated analysis fails in the lab
- Think like a conductor, not a soloist
From Trial and Error to Targeted Discovery
A polymer team is developing a new formulation for a demanding application. They adjust comonomer ratio, initiator level, solvent balance, temperature, and mixing profile. At the same time, they track modulus, elongation, thermal behavior, appearance, and processing stability. Every experimental run creates not one answer, but a bundle of outcomes.
That's where frustration usually begins. A scientist notices that raising temperature helped conversion in one set of runs, but not in another. Another scientist thinks the primary driver is catalyst concentration. Process engineering points to mixing conditions. Quality suspects raw-material variation. Everyone has part of the picture, but no one can see the whole system clearly.
Traditional analysis often treats this like a sequence of small questions. Check one variable. Compare two variables. Plot one response against one factor. That can be useful early on, but it doesn't match reality of formulation science, where several inputs move together and several outputs matter at once.
In R&D, the hard problem usually isn't collecting data. It's separating the few signals that matter from the many measurements that move together.
Multivariate analysis gives the team a way to do that. Instead of asking, “What does temperature do by itself?” it asks, “How do temperature, composition, and process conditions behave together, and how does that combined pattern connect to the material properties we care about?” That's a very different question.
For materials chemists, the payoff is practical:
- Fewer blind iterations because the team can identify which variables are moving in lockstep.
- Clearer tradeoff management when improving one property hurts another.
- Better experiment design because the next run can target uncertainty, not habit.
- More useful historical data because old formulation tables become training material, not archived clutter.
This shift matters even more in polymer R&D because many useful measurements are correlated. Mechanical properties often travel together. Spectral features often reflect overlapping chemistry. Processing variables can influence multiple downstream outcomes at once. A method that handles variables jointly is closer to the physics and chemistry of the system than one that chops the problem into disconnected pieces.
Beyond One Variable What Multivariate Analysis Really Means
Why isolated analysis fails in the lab
Many definitions stop at “more than two variables.” That's true, but it's not enough to help a chemist decide when to use these methods or why they matter.
The useful definition is this. Multivariate analysis studies how variables relate as a group. It's typically needed when you have three or more variables, because simple pairwise comparisons often miss hidden patterns in high-dimensional data, as explained in Stats Thinking 21's discussion of multivariate data.
In materials work, that hidden structure shows up constantly. Two formulations may have similar tensile strength, but for completely different reasons. One may get there through backbone chemistry, another through filler interaction and processing history. If you only compare one property at a time, those distinctions disappear.
A simple way to think about it is through an orchestra. Univariate analysis listens to one instrument. Bivariate analysis listens to two. Multivariate analysis listens to the full ensemble and tries to understand how the instruments combine into something coherent. For a formulation chemist, the “music” is the material behavior, and the instruments are composition, process conditions, and measured properties.
A short visual explanation helps before going deeper:
Think like a conductor, not a soloist
Once you make that shift, the phrase what is multivariate analysis starts to feel less abstract. It isn't just a larger spreadsheet. It's a different way of reasoning.
Here's what that means in day-to-day R&D:
- You stop treating variables as independent unless you've checked. In real experiments, they often aren't.
- You look for structure, not just significance. The question becomes “what pattern explains this system?” rather than “did this one factor move?”
- You match the method to the decision. Some methods predict. Others compare groups. Others uncover latent structure.
Practical rule: If your decision depends on several inputs and several responses at the same time, you're already in multivariate territory whether you label it that way or not.
That's why these methods matter so much in AI-driven materials discovery. Modern models don't become useful by staring at isolated columns. They learn from combinations, covariance, shared trends, and interactions. Multivariate analysis gives those patterns a statistical language that scientists can inspect and trust.
Your Toolkit of Multivariate Analysis Methods
Two families of methods
A practical way to organize multivariate methods is by the question you're asking. One educational overview separates them into dependence-based methods and interdependence-based methods, where the right choice depends on the research question, as described in CareerFoundry's taxonomy of multivariate analysis.
For a materials team, that distinction is very useful.
Dependence-based methods are for prediction or explanation when you have a defined outcome in mind. You know what you want to model, such as tensile strength, viscosity, shrinkage, or pass/fail classification.
Interdependence-based methods are for pattern discovery when you don't want to force the data into a predefined target yet. You want to find structure, reduce complexity, or group similar samples.
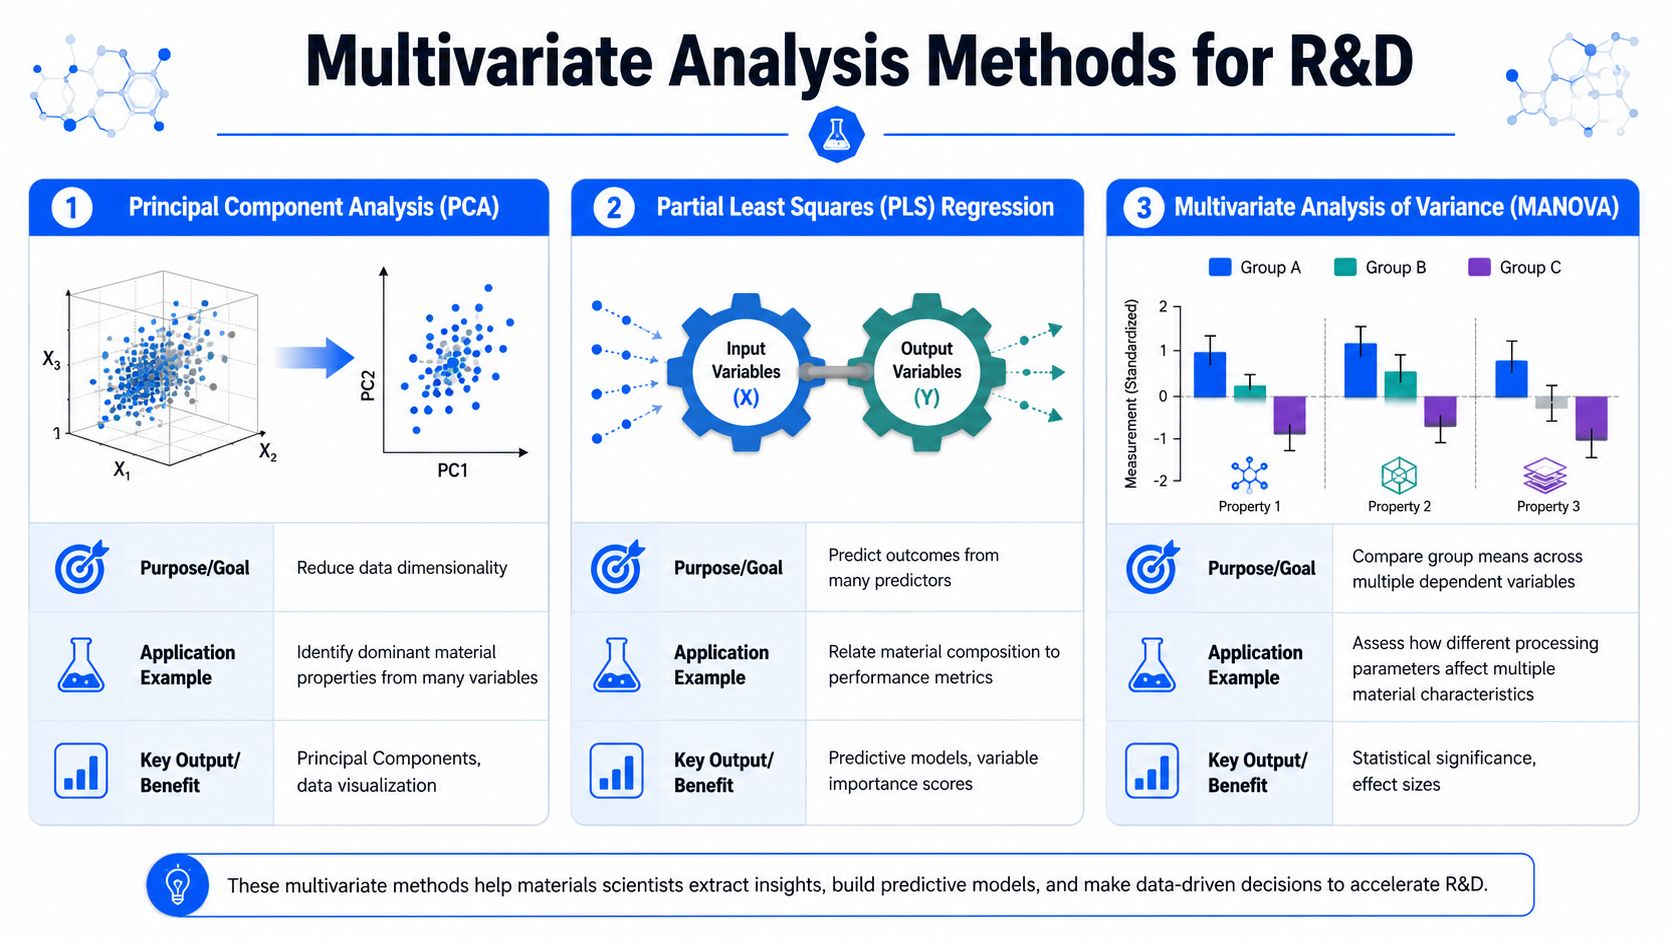
Here's how common methods map to real lab work:
- Multiple regression fits when you want to predict one outcome from many predictors. Example: estimating a target property from formulation and process settings.
- MANOVA fits when you want to compare groups across multiple dependent variables at once. Example: comparing processing windows while considering several material properties together.
- PCA fits when you have many correlated measurements and need a simpler view of variation.
- Factor analysis fits when you suspect several observed variables reflect a smaller set of underlying drivers.
- Cluster analysis fits when you want to group formulations, batches, or sample families by similarity.
- Structural equation modeling fits when you need to represent more complex relationships, including latent constructs.
Choosing the right method for the job
Chemists usually don't struggle with the math first. They struggle with method selection. The easiest fix is to ask what job needs to be done.
| Method | Primary Goal | Example R&D Question |
|---|---|---|
| PCA | Reduce complexity and reveal dominant variation | Which combinations of measured properties separate these formulations? |
| Multiple regression | Predict a response from several inputs | Which formulation and process variables best predict viscosity? |
| MANOVA | Compare groups across several outcomes | Do these processing conditions shift the overall property profile? |
| Factor analysis | Uncover latent dimensions | Are several test results really reflecting the same hidden performance factor? |
| Cluster analysis | Group similar samples | Which formulations behave like natural families rather than isolated points? |
| Structural equation modeling | Model complex linked relationships | How do composition, process, and latent quality traits connect in one framework? |
A few field notes make this more concrete:
Use PCA when the spreadsheet is wider than your intuition
Spectroscopy, rheology, thermal analysis, imaging, and formulation metadata can produce far more columns than a human can mentally integrate. PCA compresses those correlated measurements into a smaller set of components so you can inspect trends, outliers, and groupings.
Use regression when the lab needs prediction
If the business question is, “Can we estimate property X before we run a full test panel?” prediction methods are usually the right place to start. They connect controllable inputs to a measurable output.
Use clustering when the sample library is messy
Legacy programs often accumulate years of experiments with inconsistent naming and uneven logic. Cluster analysis can help reveal whether your material library already contains families of similar behavior that no one had formally labeled.
The method should follow the decision. Don't start with PCA because it's familiar. Start with the R&D question that's blocking progress.
One note on terminology. In day-to-day industrial practice, teams also use related tools such as PLS regression because they're effective for linking many predictors to outcomes, especially when variables are correlated. Even when a specific technique sits outside a basic teaching list, the same multivariate mindset applies: study the system jointly, not one column at a time.
From Raw Data to R&D Insights A Practical Walkthrough
Start with a formulation table
Take a simple example. You have a table of polymer formulations. Each row is one experiment. Columns include monomer ratio, catalyst level, temperature, mixing speed, solvent fraction, and measured responses such as modulus, elongation, glass-transition behavior, color shift, and viscosity.
At this point, the table is hard to reason about directly. Some variables are on different scales. Some move together. Some are redundant. A scientist can scan it, but not fully “see” the structure.
That's why Principal Component Analysis became such a foundational method. It was developed by Karl Pearson in 1901, and its purpose was to reduce many correlated measurements into a smaller set of informative components, according to the historical overview of multivariate statistics.
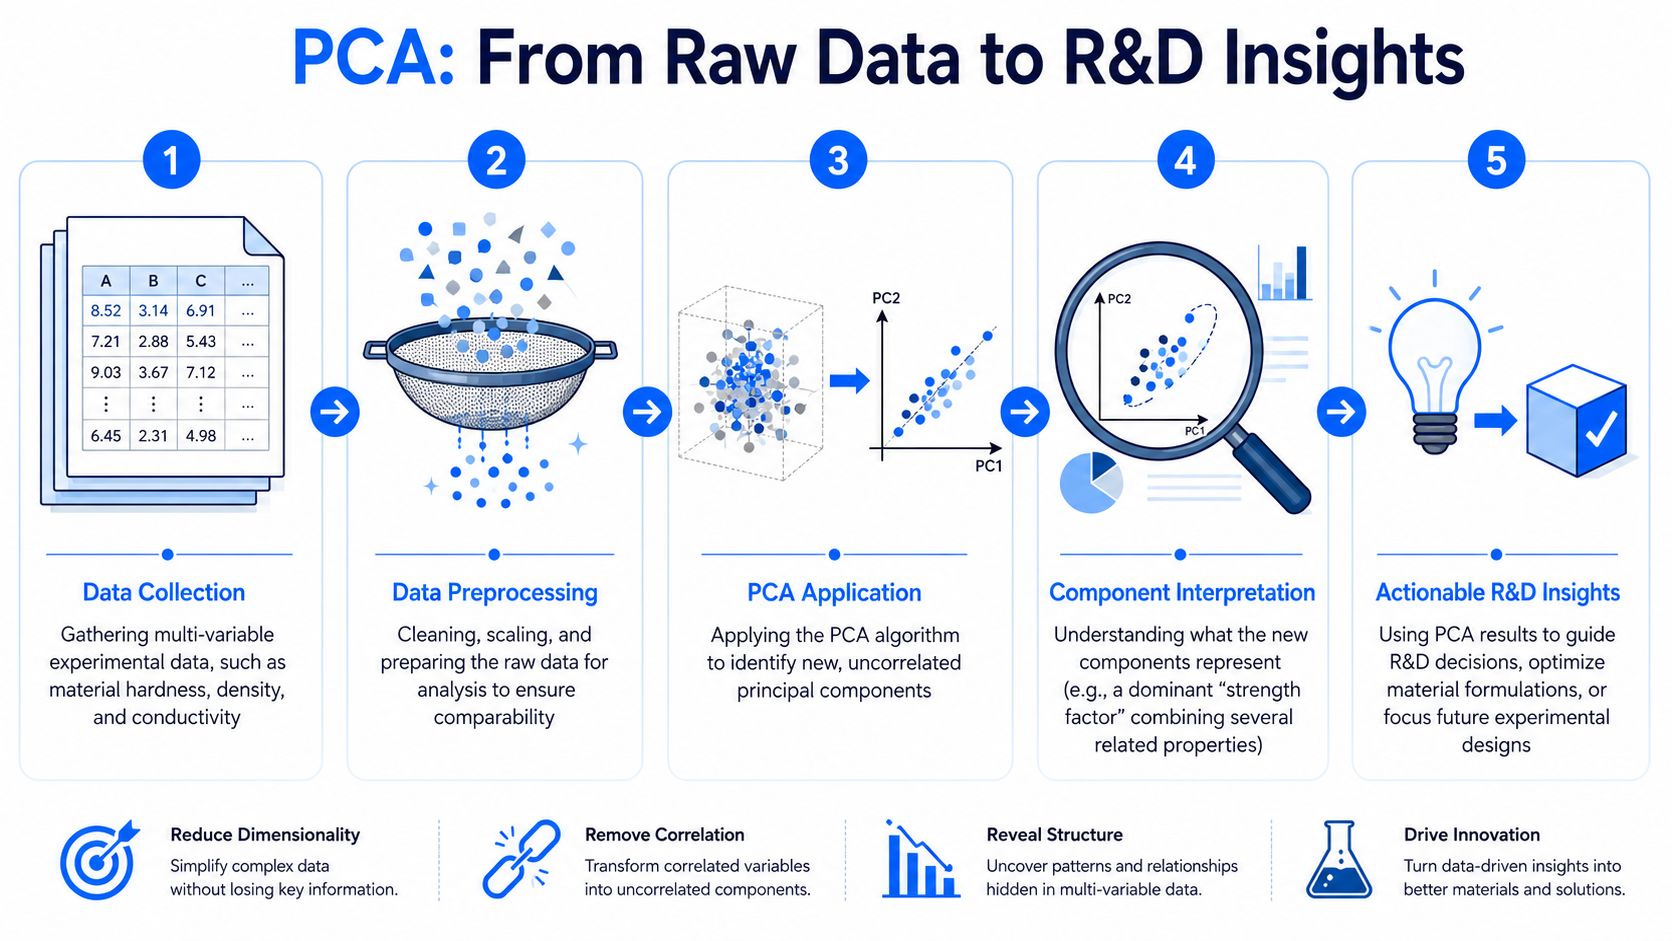
A practical PCA workflow usually looks like this:
- Collect the data from experiments, instruments, and property tests.
- Preprocess it by cleaning obvious issues and scaling variables so one measurement range doesn't dominate the rest.
- Apply PCA to transform the original variables into a smaller number of components.
- Inspect score patterns to see which samples group together or stand apart.
- Read loadings to understand which original variables shape each component.
How to read PCA output in plain language
This is the part that often gets overcomplicated. The output isn't telling you “the truth” in a magical sense. It's giving you a compact map of variation.
Suppose several formulations cluster together on a scores plot. In plain English, that means those formulations share a similar overall profile across the variables included in the model. If one cluster contains formulations with high thermal resistance and similar rheology, that group may represent a viable formulation family.
Now look at the loadings. If certain variables point in the same direction, they tend to increase together in the dataset. If others point in opposite directions, they may represent a tradeoff. For a chemist, that's often the key insight. The model isn't just reducing columns. It's surfacing relationships that guide formulation choices.
Here are the kinds of interpretations that matter in the lab:
- Clustered samples can indicate formulation families worth developing further.
- Isolated points can flag outliers, unusual chemistry, or measurement problems.
- Aligned variables can show properties that tend to improve together.
- Opposing variables can reveal tensions such as processability versus end-use performance.
A useful PCA interpretation sounds like a lab decision, not a math lecture. “These samples form a stable family.” “Those runs are outliers.” “This property tradeoff is real.”
Once you can read the plot that way, PCA stops being an academic requirement and becomes an R&D conversation tool. It helps a cross-functional team align faster because the data structure is visible, not buried in dozens of disconnected charts.
Real-World Wins in Materials and Chemical R&D
Where joint analysis changes decisions
Multivariate analysis is most useful when variables are interdependent because it analyzes them jointly rather than one at a time, which supports prediction, classification, and structure discovery from the same dataset, as noted by the University of West Georgia's overview of multivariate analyses.
That's exactly the setting most materials teams operate in. A few common examples show why.
A formulation group working on a composite may want to estimate final performance from ingredient levels and process conditions. A dependence-based model helps the team separate the inputs that are informative from the ones that only appear important when viewed alone. That can change which experiments get prioritized next.
A process development team may need to understand batch-to-batch inconsistency in a specialty chemical line. PCA or clustering can reveal that off-spec batches aren't random. They may form a pattern linked to a small set of process conditions or raw-material signatures. Once those samples group together, root-cause work becomes more focused.
An applications team developing an adhesive may be balancing cure behavior, bond performance, and handling properties. Looking at each output separately can send the team in circles. A multivariate view helps them see the formulation region where tradeoffs become acceptable rather than perfect on one metric and poor on the rest.
Why this matters for speed and scale-up
The business value doesn't come from using an advanced method for its own sake. It comes from tightening the loop between data, interpretation, and experimental action.
In practice, teams use these methods to:
- Screen formulation space so they don't spend bench time on combinations that already look structurally weak.
- Translate instrument data into property-relevant patterns rather than storing raw outputs with little interpretation.
- Support scale-up decisions by comparing lab and pilot runs across multiple responses, not a single checkpoint.
- Improve cross-team alignment because chemists, engineers, and data scientists can discuss the same shared model.
Many organizations see the biggest shift at this point. They move from “we ran many experiments” to “we learned systematically from each experiment.” That's a different operating model. And it's one reason multivariate methods sit so close to modern AI workflows in industrial R&D.
Bridging to AI How MVA Powers Modern Experiment Planning
Common mistakes before teams adopt AI
AI doesn't replace multivariate thinking. It builds on it. If a team doesn't understand variable relationships, correlated predictors, noisy measurements, and the difference between pattern discovery and prediction, the resulting models are hard to trust.
The most common problems show up before the first machine learning workflow is even deployed:
- Overfitting the historical data so the model explains old runs but doesn't guide new ones well.
- Confusing correlation with mechanism and assuming every statistical relationship is causal.
- Ignoring data quality issues such as inconsistent naming, missing process context, or shifted test methods.
- Using the wrong objective by optimizing a single metric when the actual decision involves several properties.
Teams also run into infrastructure issues. Experimental data often sits across ELNs, spreadsheets, instruments, and production systems. When that happens, it helps to look at examples from adjacent data-heavy industries. If your organization is also thinking about scalable data architecture, directories like Databricks consultants on DataEngineeringCompanies.com can be useful for understanding how companies structure complex analytics environments.
From analysis to next-best-experiment planning
At this stage, the workflow shifts. Classical multivariate analysis tells you how variables have behaved together. AI can take that learned structure and help propose what to test next.
In materials R&D, that means a platform can ingest historical experiments, detect relationships among formulation variables and outcomes, estimate likely performance for untested combinations, and recommend the next experiments that are most informative. The point isn't automation for its own sake. The point is reducing guesswork while keeping the reasoning inspectable.
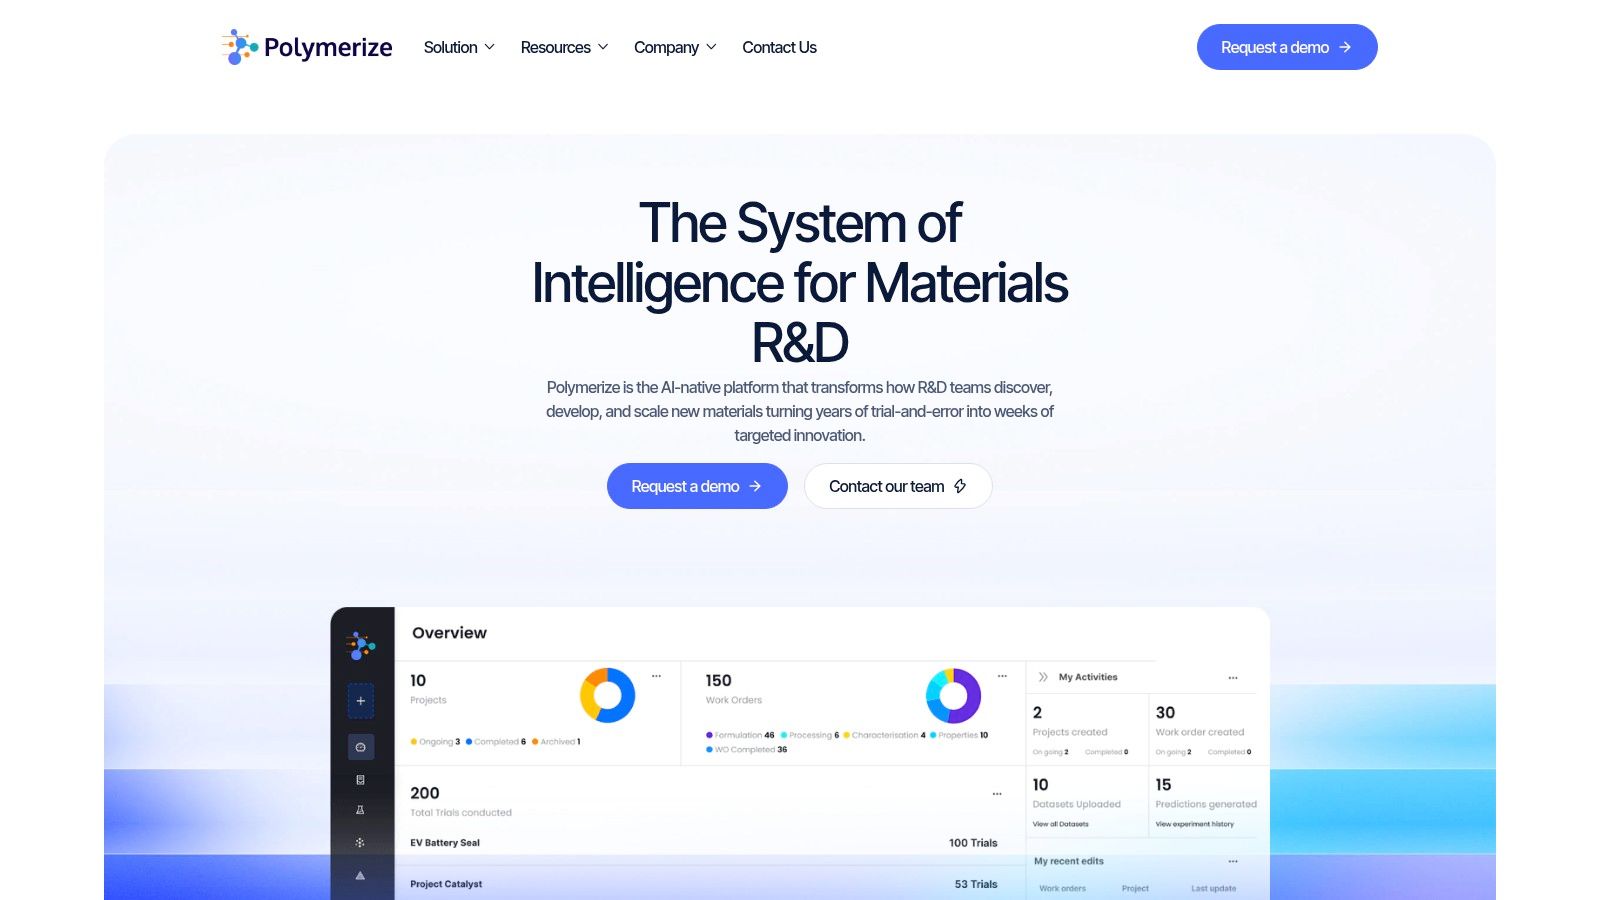
One example is Polymerize, which provides an AI-native system for materials R&D that unifies experimental data and applies domain-specific, explainable models to predict properties, optimize formulations, and support next-experiment planning. For a chemist, that translates into a familiar benefit. You spend less time asking, “Which trial should we run?” and more time evaluating promising candidates.
Good AI in R&D doesn't hide the multivariate logic. It makes that logic easier to use, test, and act on.
That's the bridge from statistics to operational acceleration. Multivariate analysis explains the structure of the problem. AI helps the team work through that structure faster.
Your Next Step in Data-Driven Materials Innovation
The shift isn't from simple stats to advanced stats. It's from isolated experiments to connected learning. Once a team starts treating formulation, process, and performance data as one system, better decisions become more repeatable.
That's why understanding what multivariate analysis is matters so much in polymer and chemical R&D. It gives scientists a way to work with the full complexity of materials instead of flattening it into disconnected charts. And once that foundation is in place, AI can help convert historical data into better experimental choices.
If you want a useful analogy from another domain, look at how teams build innovative flight delay solutions by combining multiple operational signals rather than relying on one metric. Materials R&D has the same lesson. Better outcomes come from modeling interacting variables together.
If your team is trying to turn fragmented experimental data into faster formulation learning, Polymerize is worth a look. It's designed for materials R&D teams that need a structured way to connect data, apply explainable models, and decide the next experiment with more confidence.

