Your team has a backlog of formulation ideas, a queue of instrument time, and a familiar pattern: change one variable, run a batch, inspect the result, then debate what to change next. It feels disciplined because each experiment is controlled. In practice, it often turns into slow-motion guessing.
That cycle is especially painful in polymers and chemicals. A resin ratio that looks promising at one temperature can fail at another. A processing aid that helps flow can unexpectedly reduce strength once drying conditions shift. By the time the team notices, weeks of lab work are gone and nobody is fully sure which variable was the critical factor.
That's where DOE design of experiment becomes more than a statistics topic. It becomes an R&D operating model. Used well, DOE helps scientists learn from a structured set of runs instead of from disconnected trial-and-error. In modern materials programs, that matters even more because teams now have two opportunities at once: they can use classical DOE to generate clean, informative data, and they can use AI tools to turn that data into better next-step decisions.
Table of Contents
- Beyond Trial and Error Why Systematic Experimentation Wins
- What the experiment is really made of
- Why execution discipline matters
- Start with the decision, not the spreadsheet
- Build a design your lab can run
- Analyze for action, not decoration
Beyond Trial and Error Why Systematic Experimentation Wins
Most lab teams don't choose one-factor-at-a-time work because they love inefficiency. They choose it because it feels safe. Change antioxidant level this week. Adjust barrel temperature next week. Swap one filler grade after that. Each step looks logical on its own.
The problem is that materials systems rarely behave one variable at a time. A plasticizer can look harmless until it interacts with drying conditions. A catalyst level can appear unimportant until residence time changes. OFAT testing hides that structure because it asks the wrong question. It asks, “What happens when I change this one thing alone?” R&D usually needs the harder question: “What happens when several controllable things move together?”
Design of Experiments emerged from the work of Ronald A. Fisher in the 1920s and established the idea that multiple factors should be studied simultaneously rather than one at a time, a shift that made experiments more efficient and improved reliability in modern R&D according to Synthace's overview of DOE.
Practical rule: If you suspect interaction effects and still run OFAT, you're often collecting data that can't answer the decision you actually need to make.
In materials development, that difference is strategic. DOE doesn't just trim experimental waste. It changes the output of the campaign from a stack of isolated observations into a model of how the system behaves inside a defined operating space.
That's why seasoned teams use DOE early, not only after trial-and-error fails. They want to identify the variables that drive yield, impurity, strength, flow, cost, or stability before they burn through raw materials and pilot time. In polymer development, that usually means understanding formulation and processing together, because customers never buy a formulation in isolation. They buy a material that has to survive compounding, conversion, and scale-up.
The Core Principles of DOE
DOE works because it forces precision in how the team thinks before it ever touches a reactor, mixer, or extruder. The mechanics are simple. The discipline is not.
What the experiment is really made of
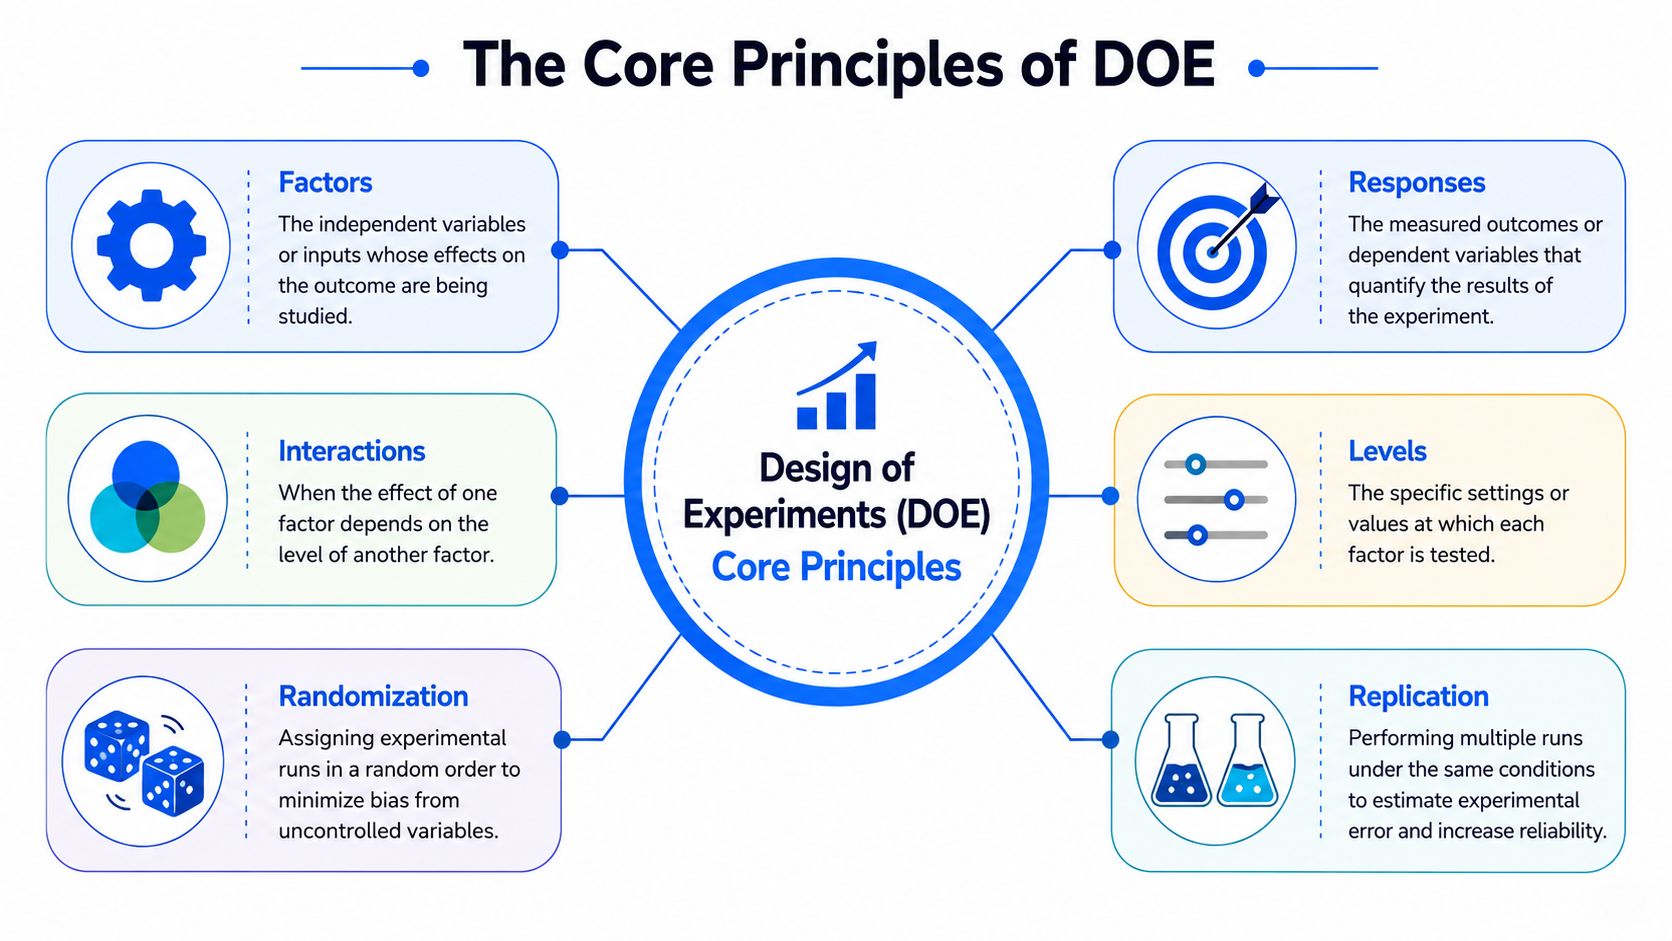
A DOE starts with three basic elements:
- Factors are the controllable inputs. In a polymer lab, these might include additive loading, screw speed, melt temperature, drying time, or vendor.
- Levels are the specific settings assigned to each factor. Low and high are the simplest case, but the choice has to reflect physically meaningful ranges.
- Responses are the measured outputs, such as tensile strength, haze, gel content, yield, impurity, or cost.
A useful analogy is baking. If flour type, oven temperature, and bake time are your factors, the levels are the chosen settings for each one, and the response is what you measure at the end, maybe texture or rise. The reason DOE beats casual kitchen experimentation is that it studies combinations in a structured way, so you can tell whether temperature matters on its own or only when paired with a certain flour.
In a two-level full factorial design, the number of runs scales as 2^n, where n is the number of factors. That means 3 factors require 8 runs, 4 factors require 16, and 5 factors require 32, before replication or center points are added, as explained by ASQ's Design of Experiments resource. That structure is what lets DOE estimate main effects and interactions in the same campaign.
Why execution discipline matters
The statistics only help if the experiment is run in a way that protects the data.
- Randomization matters because lab conditions drift. Instrument warm-up, operator fatigue, room humidity, and raw-material aging can create patterns that look like factor effects when they're really just time effects.
- Replication matters because materials data is noisy. Without repeated conditions, teams can't separate real signal from ordinary process variation.
- Blocking matters when you already know a nuisance source of variation exists, such as different resin lots, different days, or different pieces of equipment.
Good DOE planning asks two questions at once. What do we want to learn, and what could fool us into thinking we learned it?
Analysis typically uses ANOVA or regression, but the software isn't the hard part. The hard part is building the design so the output will be worth analyzing. Teams new to DOE often focus heavily on the model and too little on run order, material prep consistency, and measurement discipline. In practice, those details decide whether your statistical output becomes a useful process map or just a polished mistake.
Choosing the Right Experimental Design
Choosing a design starts with the constraint set, not the software menu. In materials R&D, that usually means balancing three things at once: how many variables could matter, how expensive each run is, and how quickly the team needs a decision.
A formulation team screening ten ingredients does not need the same design as a process team fine-tuning extrusion temperature and screw speed around a known target. That sounds obvious, but many DOE failures come from using a design that answers a different question than the one the project faces.
When screening is the right move
Early-stage programs usually have a crowded factor list. Resin choice, additive level, catalyst ratio, mix order, shear rate, cure schedule, drying conditions, hold time. If the team tries to optimize from that starting point, run count climbs fast and interpretation gets messy.
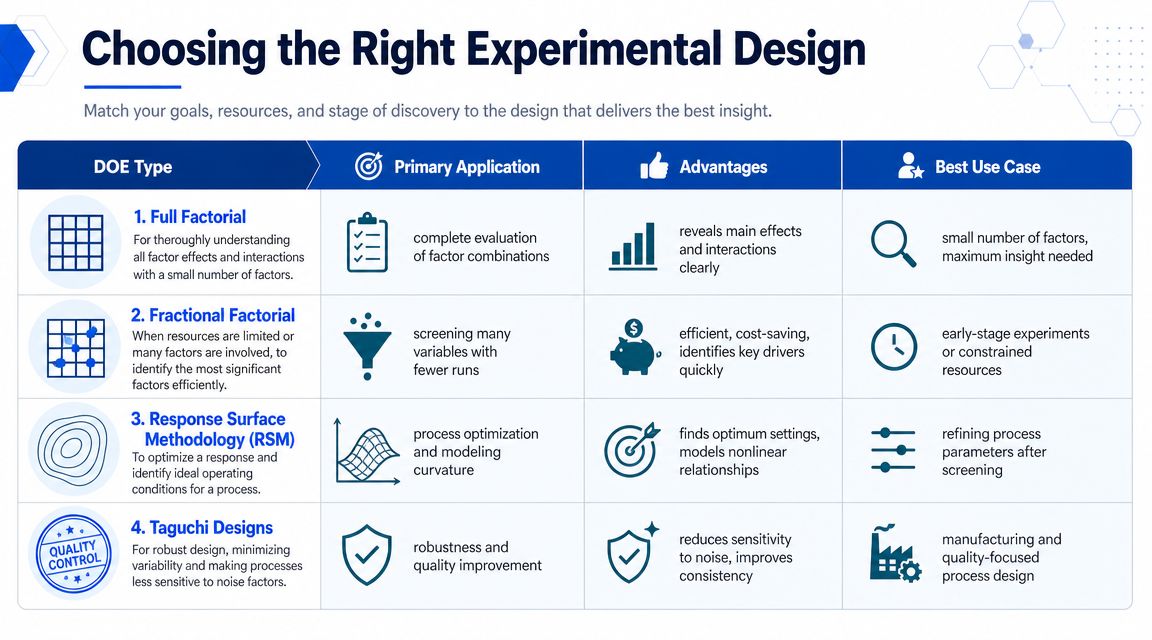
Factorial designs are usually the right first step because they help teams separate signal from noise across many plausible variables. A full factorial is the clearest option when factor count is still modest and interaction effects matter to the chemistry or process. A fractional factorial is often the better business decision when lab time, material availability, or analytical throughput are tight.
The trade-off is practical. Full factorial designs give cleaner effect estimates. Fractional designs reduce burden, but some effects are aliased. In polymer and chemical work, that trade-off is often acceptable in the first pass because the goal is to identify the few variables worth deeper work, not to fully map the response surface on day one.
This is also where modern R&D teams can combine DOE with AI tools effectively. DOE provides the structured test plan. AI models can help rank candidate factors, flag underexplored regions, or suggest where prior project data may justify a smaller screening space. Used well, that combination saves runs without turning the campaign into a black box.
When optimization becomes the main task
Once the team has narrowed the field to a few high-impact factors, the question changes. The job is no longer to identify which variables matter. The job is to define the operating region that delivers the best balance of performance, manufacturability, and cost.
At that point, Response Surface Methodology is often the better fit. Designs such as Box-Behnken and Central Composite are built for estimating curvature and locating an optimum region. That matters in materials development because many responses are nonlinear within the usable process window. Viscosity, conversion, mechanical strength, and surface quality often shift gradually in one range and sharply in another.
A screening design can tell a team that temperature matters. It usually cannot tell them where temperature stops helping and starts degrading the formulation.
A practical decision view
Here is the decision frame I use with technical teams:
| Design type | Best use | What it gives you | Main risk |
|---|---|---|---|
| Full factorial | Small factor set, strong need to estimate interactions clearly | Direct view of main effects and interactions | Run count increases quickly |
| Fractional factorial | Large factor set, limited lab or pilot capacity | Efficient screening of likely drivers | Aliasing can blur interpretation |
| RSM | Short list of known critical factors, optimization stage | Curvature estimates and a usable optimum region | Poor choice if screening is incomplete |
| Taguchi | Process consistency studies with known noise factors | A structured way to study control factors against variation sources | Easy to misuse when interaction modeling is the primary goal |
Taguchi methods can be useful, especially for manufacturing-focused studies where the team wants performance that holds up across expected variation in materials or operating conditions. But they are not a substitute for a well-planned factorial or response surface study when the team still needs detailed interaction insight.
The best sequence is usually staged. Screen broadly. Refine the factor set. Optimize the few variables that matter in the region where product and process targets intersect. That staged approach is one of the clearest ways to shorten development cycles, and it becomes even more valuable when AI-assisted modeling is layered on top of a disciplined DOE foundation.
A Stepwise DOE Workflow for Materials R&D
A formulation team blocks off a week of instrument time, lines up raw materials, and launches a DOE. By day three, half the batches are hard to compare because prep conditions drifted, one factor range is clearly unrealistic, and the data package is already messy. The statistics are not the first problem. The plan is.
That is why DOE in materials R&D needs a workflow, not just software. The design has to fit chemistry, process limits, safety constraints, analytical capability, and lab capacity at the same time. Teams that handle those choices up front get cleaner results and reach decisions faster. Teams that skip them usually pay for it in reruns.
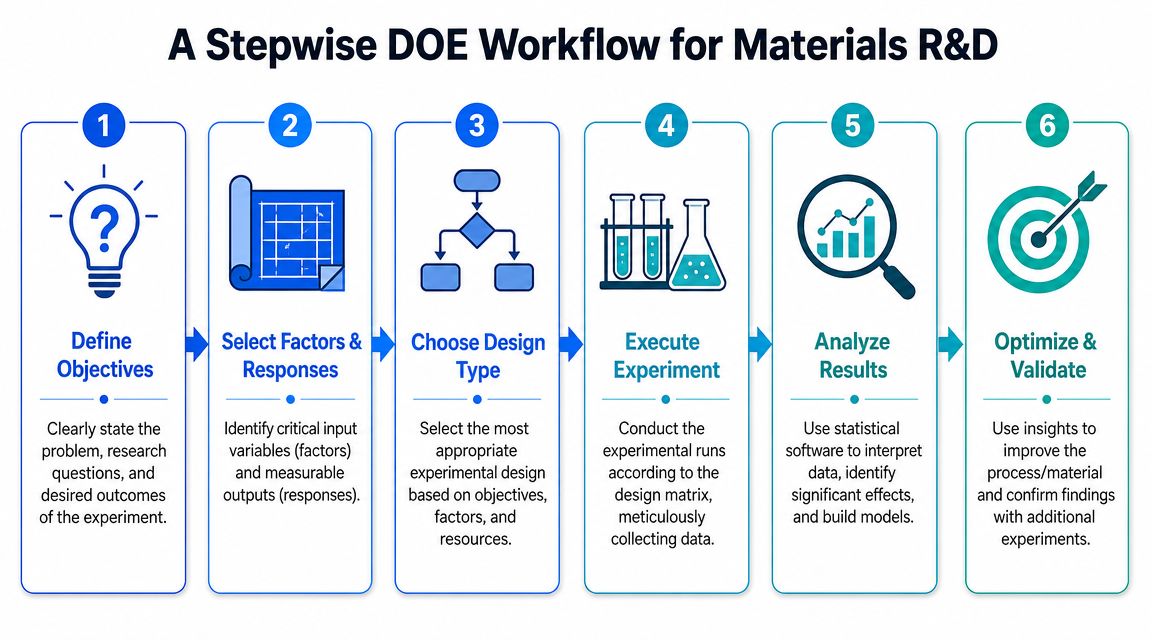
Start with the decision, not the spreadsheet
The first job is to define the decision in operational terms. “Improve performance” is too vague to guide a useful design. “Increase tensile strength while keeping cost and extrusion stability within range” gives the team something they can test and act on.
Then choose responses that match that decision. In materials work, that often means balancing product properties with process behavior. Tensile strength, impact resistance, haze, viscosity, cycle time, and raw-material cost can all matter in the same study. The point is not to measure everything possible. It is to separate primary responses from constraints so the analysis supports a real development choice.
A practical sequence looks like this:
- State the decision clearly. Use language a product, process, or scale-up team would recognize.
- Select measurable responses. If the test method is noisy or poorly controlled, fix that before running DOE.
- List candidate factors. Include both formulation and process variables when both could change the outcome.
- Set response priorities. Decide what must improve, what must stay within bounds, and what can be traded off.
That last step matters more than many teams expect. In polymer and chemical development, the best-performing condition on one response is often unusable on another. Good DOE planning makes those trade-offs visible early, which is one reason it pairs so well with AI-assisted modeling later. The experiment creates structured data. The model helps the team search that space more efficiently.
DOE software should document a decision that is already well defined, not rescue a vague one.
Build a design your lab can run
Factor selection is where teams often lose the plot. Narrow ranges can hide effects. Overly broad ranges can push the system into degradation, phase separation, unstable mixing, unsafe conditions, or batches that no plant engineer would approve.
The right ranges are informative, feasible, and credible for scale-up. In practice, that often means a short feasibility pass before the main DOE when the operating window is still uncertain. A few quick boundary checks can save weeks of wasted experimental effort.
The next choices are practical, not cosmetic. Run order affects exposure to drift. Center points help reveal curvature and monitor whether the process is staying stable. Replicates improve confidence that a detected effect is real rather than noise. Wider factor spacing can improve sensitivity, but only if the region remains chemically and operationally valid. Those are the trade-offs that make or break a useful study.
Execution needs more than a run sheet. It needs a run protocol that keeps variation from slipping in through the back door.
- Material prep controls: drying conditions, addition order, mixing time, hold time, and batch labeling
- Operator controls: who runs each step, where handoffs occur, and how deviations are recorded
- Measurement controls: calibration status, specimen conditioning, and test timing
- Data capture controls: one structure for recording target settings, actual settings, observations, and failed runs
I treat failed runs as data, but only if the team records them properly. In materials programs, those “bad” outcomes often define the true edge of the feasible region. That is valuable information for both DOE interpretation and any later machine-learning work.
To ground the process, this walkthrough is useful for teams that want a visual explanation before building their own campaign:
Analyze for action, not decoration
Once results are in, the team usually fits ANOVA or regression models to identify important terms and estimate response behavior across the studied region. The standard is not whether the output looks polished. The standard is whether the model is good enough to support the next technical or business decision.
Look for a few practical outputs:
- Directionality: which factors raise or lower each response
- Interactions: where one factor changes the effect of another
- Model adequacy inside the tested region: whether predictions are reliable enough to guide follow-up work
- Operational fit: which settings still work under production-like constraints
Then validate the recommendation with confirmation runs. Run them near the proposed optimum or inside the operating window the team expects to use. If the confirmation data misses the prediction, do not force the interpretation. Check the factor definitions, execution record, measurement quality, and whether the model was asked to predict outside the region it was built to describe.
That discipline is what turns DOE from a statistics exercise into a development engine. In a modern materials workflow, it also creates the structured experimental history that AI tools use well. Classic DOE tells you where to sample with intent. AI helps decide where the next sample is worth the cost. Together, they shorten the path from broad experimentation to targeted polymer and chemical innovation.
DOE in Action A Polymer Formulation Case Study
Consider a team developing a biodegradable polymer blend for rigid packaging. They need a formulation that improves tensile performance without pushing material cost into an unacceptable range. The team also knows processing matters because the same blend can behave very differently depending on thermal history.
Defining a safe experimental region
Their first instinct is to launch a broad DOE across composition, plasticizer choice, and processing temperature. That's where experienced formulation scientists slow down. In polymer systems, the first DOE question often isn't the design type. It's whether the chosen factor region is valid.
That caution is well founded. In materials R&D, a common challenge is working with factor ranges that are unknown or that may cross phase boundaries, and DOE models are primarily useful for interpolation within the tested space, as noted in this discussion of experimental region definition in materials systems.
So the team starts with a bounded region. They choose realistic composition ranges based on processability and prior compounding experience. They exclude temperatures likely to trigger visible degradation. They treat plasticizer type as a discrete factor and document that some combinations may require adjusted handling.
In polymer DOE, failed batches still teach you something, but they're expensive teachers. Define the region so failure informs the model instead of dominating it.
From screening to optimization
The team begins with a screening design because it still has several plausible drivers. The goal is not to find the final recipe immediately. The goal is to identify which variables deserve serious optimization effort.
After the screening round, a pattern emerges. Blend ratio and processing temperature appear to be the strongest levers for tensile behavior, while plasticizer choice influences processability and cost. At that point, the team does what strong R&D groups do. It narrows the problem.
Instead of continuing to test many variables broadly, the scientists move into an optimization phase focused on the smaller set of influential factors. They introduce center conditions, watch for curvature, and evaluate trade-offs rather than chasing a single maximum. The best-performing tensile condition may not be the most commercially useful if it creates narrow processing latitude or unstable extrusion behavior.
That's where DOE becomes more than a way to rank factors. It becomes a way to define a process window. The team can now discuss not just “best point” behavior, but also performance consistency. Which settings produce good tensile performance without living on the edge of degradation? Which combinations still work when normal lab-to-pilot variation appears?
For scale-up, that distinction is everything. Production teams don't want a hero formulation that only works under ideal bench conditions. They want a window they can run.
Common DOE Pitfalls and How to Avoid Them
Bad DOE usually doesn't look bad at first. It often looks organized, statistical, and data-rich. The problems show up later, when the model fails to predict, the pilot line behaves differently, or the team realizes the campaign answered a narrower question than the business had.
Where teams go wrong
Some mistakes are basic, but they're still common.
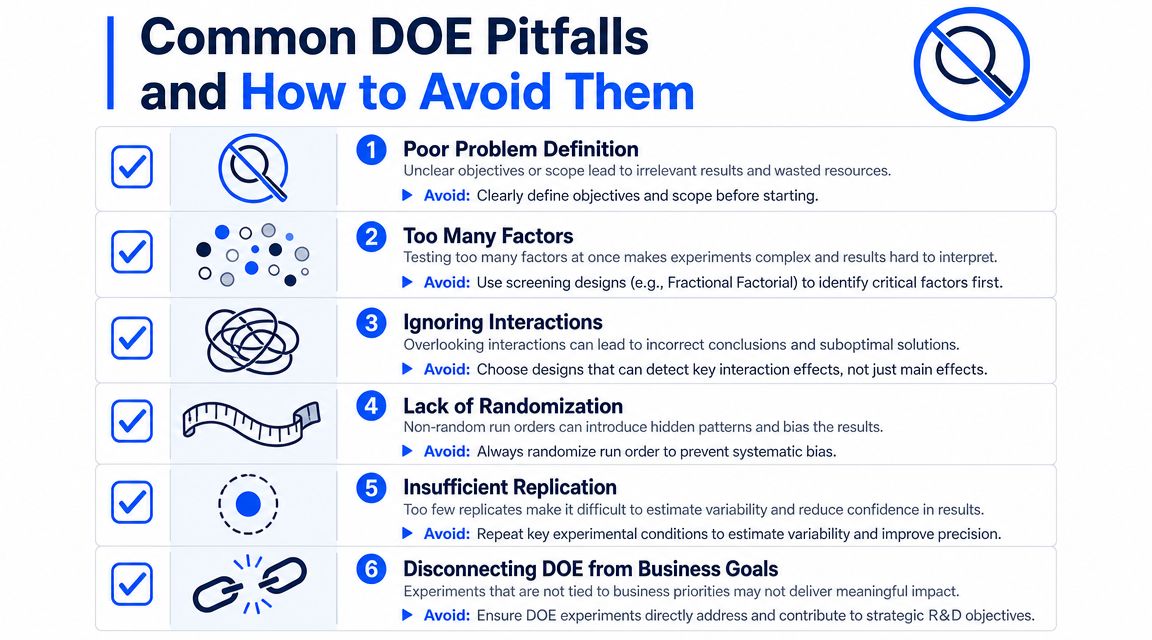
- Weak problem framing: If the team can't state the decision the DOE supports, it usually picks the wrong responses or irrelevant factors.
- Overloaded factor lists: Including every imaginable variable creates a design that's technically ambitious and operationally fragile.
- Poor level selection: Levels that are too tight hide effects. Levels that are too aggressive create failures that don't help decision-making.
- Ignoring interactions: This is the classic carryover from OFAT thinking. In materials systems, interactions are often the story.
- Skipping execution discipline: Non-randomized runs, inconsistent prep, or weak measurement practice can corrupt an otherwise good design.
A useful corrective is to ask one blunt question before launch: if this DOE works perfectly, what decision will it let us make? If nobody can answer cleanly, the design isn't ready.
When fractional designs need a second step
Fractional factorial designs are often the right choice in real labs because they reduce run burden. The mistake isn't using them. The mistake is forgetting what you traded away to get that efficiency.
In fractional designs, some effects are intentionally confounded in alias chains. If the result is ambiguous, teams may need a second stage rather than pretending the first stage gave certainty. Minitab's explanation of fractionating and folding DOE designs describes how folding can be used to add runs that break those aliases and clarify which factors are significant.
That staged approach is often the most practical one in industrial R&D. Screen fast, inspect ambiguity thoroughly, then augment the design if the decision is too important to leave confounded.
Fractional DOE saves runs. It does not eliminate uncertainty. Teams still have to decide when ambiguity is acceptable and when it's worth paying for resolution.
How AI Platforms Optimize the DOE Process
Classical DOE gives structure. AI can add speed, pattern recognition, and sequential learning. The two are complementary because they solve different parts of the same R&D problem.
Where AI helps before the first run
Many materials teams don't start from zero knowledge. They start from years of spreadsheets, scattered ELN records, pilot notes, and half-remembered formulation history. AI can help mine that history before the DOE is built.
That changes the quality of the initial design in several ways:
- Factor selection improves: historical experiments can reveal which variables are repeatedly implicated, even if prior work was not organized as formal DOE.
- Starting ranges get smarter: prior successful and failed runs help teams avoid obviously unrealistic conditions.
- Experimental context becomes reusable: processing history, raw-material lots, and prior response patterns become part of campaign planning rather than tribal memory.
Platform design matters. Some organizations build internal workflows with data science support. Others work with Agile AI engineering teams to connect lab data, analytics pipelines, and experiment-planning tools into a usable operating system for R&D.
Why DOE and AI work better together
DOE models are powerful because they are interpretable and disciplined. But advanced materials systems can be nonlinear, sparse, and messy. AI methods can help capture patterns that are difficult to express with simple linear or quadratic assumptions, especially once the first DOE rounds have generated reliable data.
The strongest workflow is usually sequential:
| Stage | Classical DOE contribution | AI contribution |
|---|---|---|
| Campaign setup | Structures factors, levels, randomization, and responses | Mines historical data to suggest relevant variables and plausible ranges |
| Initial learning | Produces clean experimental data with interpretable effects | Identifies patterns across broader historical and newly generated datasets |
| Next experiment selection | Keeps the campaign statistically coherent | Recommends informative next runs in a more adaptive way |
| Scale-up support | Defines known operating windows | Flags nonlinear risk zones and hidden dependencies |
In practice, AI shouldn't replace DOE discipline. If the incoming data is poorly structured, inconsistent, or biased by sloppy execution, AI will amplify confusion faster than a statistician can fix it. DOE provides the controlled data foundation. AI helps exploit that foundation more aggressively.
A practical example is Polymerize, which is described as providing AI-guided DOE workflows that help select important factors to test and support screening, optimal, or adaptive DOE choices based on project needs and available data. That kind of setup is useful when teams want DOE to become an iterative learning loop rather than a one-time study.
The shift is cultural. Instead of treating experiment planning as a fixed upfront event, teams can treat it as an adaptive system. Run an initial DOE. Learn which variables matter. Let models, historical context, and current data shape the next set of experiments. That's much closer to how high-performing materials R&D should operate now.
From Educated Guesses to Targeted Innovation
Trial-and-error still exists in many labs because it's familiar, not because it's effective. In polymers, chemicals, and advanced materials, the cost of that habit is slow learning. Teams run many experiments and still struggle to explain why the system behaved the way it did.
DOE design of experiment changes that by making experiments cumulative. Each run contributes to a structured understanding of factors, interactions, and workable operating space. That's what turns lab activity into decision-making.
For materials organizations under pressure to move faster, the bigger opportunity is combining classical DOE with modern AI workflows. DOE supplies rigor. AI helps teams learn across fragmented data, choose stronger next experiments, and steer through complex formulation spaces with more confidence.
The labs that adopt that combination won't stop experimenting. They'll stop experimenting blindly.
If your team wants to move from disconnected lab trials to a more structured, AI-guided experimentation workflow, Polymerize is one option to evaluate. It's built for materials R&D teams that need to unify experimental data, plan better next experiments, and connect formulation learning to scale-up decisions.

