Evaluating Predictive Models in Practice: Key Metrics for Materials R&D MAE, RMSE, R2 and Beyond
In data-driven materials R&D, selecting the right machine learning model is not just about looking at numbers. While many tools automatically calculate a wide range of metrics, it is neither necessary nor effective to check them all. What truly matters is this: What do you want to prioritize when selecting your model? Instead of memorizing individual metrics in isolation, this article introduces a practical framework that groups them into **four key evaluation perspective. By structuring your thinking this way, you can make consistent and confident decisions—regardless of the tool you use.
1. Trend Capture: Validating Model Behavior
1.1 R2 Score (Coefficient of Determination)
1.2 Explained Variance Score
2. Accuracy: Interpretable Performance Evaluation
2.1 MAE (Mean Absolute Error)
2.2 MAPE (Mean Absolute Percentage Error)
3. Risk Management: Evaluating Reliability and Safety
3.1 RMSE (Root Mean Squared Error)
3.2 Max Error
4. Special Cases: Adapting to Data Characteristics
4.1 Median Absolute Error
4.2 RMSLE (Root Mean Squared Logarithmic Error)
Important Note: Metrics Are Not Everything
Summary: A Practical Evaluation Flow
1. Trend Capture: Validating Model Behavior
Before focusing on individual prediction errors, the first step is to assess whether the model correctly captures the overall trend of the phenomenon.
This serves as a gatekeeping step before moving forward to experimental validation.
(1) R2 Score (Coefficient of Determination)
What it means:
Indicates how well the model explains the variance in the data (maximum = 1.0).
When to use:
As an initial screening metric for model selection.
A common practice is to check whether the score exceeds a predefined threshold (e.g., 0.7).
However, it is essential to evaluate test data performance, not just training data.
(2) Explained Variance Score
What it means:
Similar to R², but excludes the effect of systematic bias (average offset).
When to use:
To identify potential for improvement through calibration.
If R2 is low but explained variance is high, the model may still capture the trend correctly.
In such cases, applying a global shift (calibration) can make the model practically useful.
2. Accuracy: Interpretable Performance Evaluation
Once the model is deemed valid, the next step is to understand its predictive accuracy in practical terms.
These metrics are especially useful for reporting and decision-making.
(3) MAE (Mean Absolute Error)
What it means:
The average absolute difference between predicted and actual values.
When to use:
When you want to evaluate performance in the original unit (e.g., MPa, °C).
Compared to RMSE, MAE is less sensitive to outliers, making it suitable for baseline evaluation in early stages.
(4) MAPE (Mean Absolute Percentage Error)
What it means:
The average percentage deviation between predictions and actual values.
When to use:
When managing performance using a unified criterion (e.g., “within 10% error”).
It is particularly useful for comparing models across different scales or properties (e.g., strength vs viscosity).
3. Risk Management: Evaluating Reliability and Safety
Even if average accuracy is high, a single large error may not be acceptable—especially in quality-critical or safety-sensitive applications.
These metrics help assess risk exposure.
(5) RMSE (Root Mean Squared Error)
What it means:
Penalizes large errors more heavily due to squaring.
When to use:
When avoiding large deviations is more important than optimizing average performance.
(Note: If MSE is shown, take its square root for interpretation.)
(6) Max Error
What it means:
The largest deviation between prediction and actual value in the dataset.
When to use:
To understand the worst-case scenario.
Even if MAE is acceptable, ensure that the maximum error does not exceed safety margins.
4. Special Cases: Adapting to Data Characteristics
Some datasets are inherently challenging—noisy, sparse, or spanning multiple orders of magnitude.
These metrics are designed for such cases.
(7) Median Absolute Error
What it means:
The median of absolute errors.
When to use:
When the dataset contains many outliers or noise.
It provides a more robust evaluation than mean-based metrics.
(8) RMSLE (Root Mean Squared Logarithmic Error)
What it means:
Calculates error after applying a logarithmic transformation.
When to use:
For properties spanning multiple orders of magnitude (e.g., viscosity, electrical resistance).
It ensures that relative differences are treated fairly across low and high value ranges.
Important Note: Metrics Are Not Everything
While these metrics are useful, they are ultimately summarized statistics.
They may hide critical issues such as:
- Good overall accuracy, but poor predictions in high-performance regions
- Systematic bias in specific ranges
For this reason, it is strongly recommended to always review a Parity Plot (Predicted vs Actual) before making final decisions.
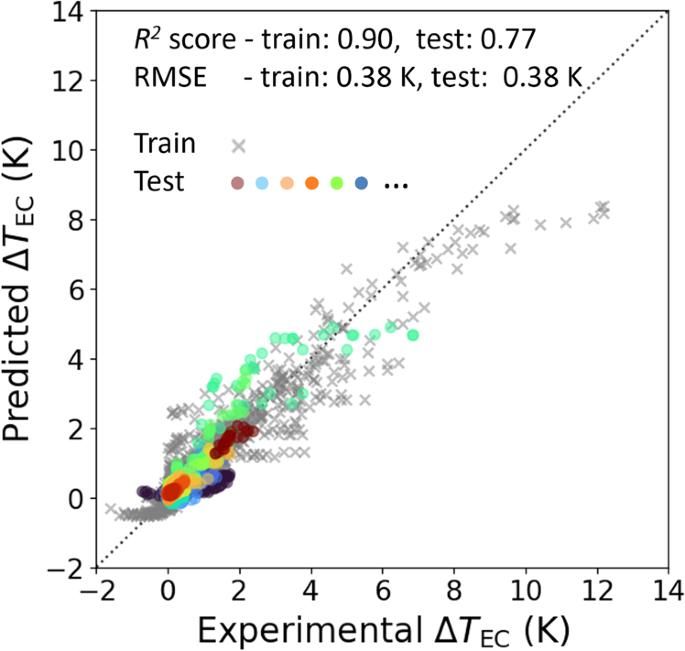
By visualizing the distribution, you can quickly detect:
- Systematic bias
- Region-specific deviations
- Signs of overfitting
Most platforms provide built-in visualization tools for this purpose.
Summary: A Practical Evaluation Flow
When in doubt, follow this sequence:
1. Trend (R2)→ Does the model capture the underlying behavior?
2. Accuracy (MAE / MAPE)→ Is the error within a practical range?
3. Risk (RMSE / Max Error)→ Are large deviations under control?
4. Special Cases (Median / RMSLE)→ Is the metric appropriate for your data characteristics?
5. Final Check (Parity Plot)→ Are there hidden biases or problematic regions?
Final Thoughts
In platforms such as Polymerize Labs, many of these metrics are automatically calculated and readily available.
Rather than spending time on manual calculations, researchers should focus on what truly matters:
Which evaluation perspective is most critical for this project—accuracy, robustness, or risk?
That strategic decision is what ultimately drives better outcomes in AI-driven materials development.
Begin with a trial and start building the foundation for your future, today.
Interested in exploring further?
Get in touch: marketing@polymerize.io
Request a demo: https://calendly.com/polymerize/product-demo

