



Glass transition temperature is the temperature range where a polymer shifts from a hard, glassy state to a rubbery, flexible state, and it's usually treated as an operational point tied to a measurement timescale of about 100 s rather than a sharp phase boundary. For many synthetic polymers, Tg falls between 170 K and 500 K, or roughly -103°C to 227°C, which is why the same material can feel perfectly rigid in one use and unworkable in another (glass transition overview, polymer Tg reference values).
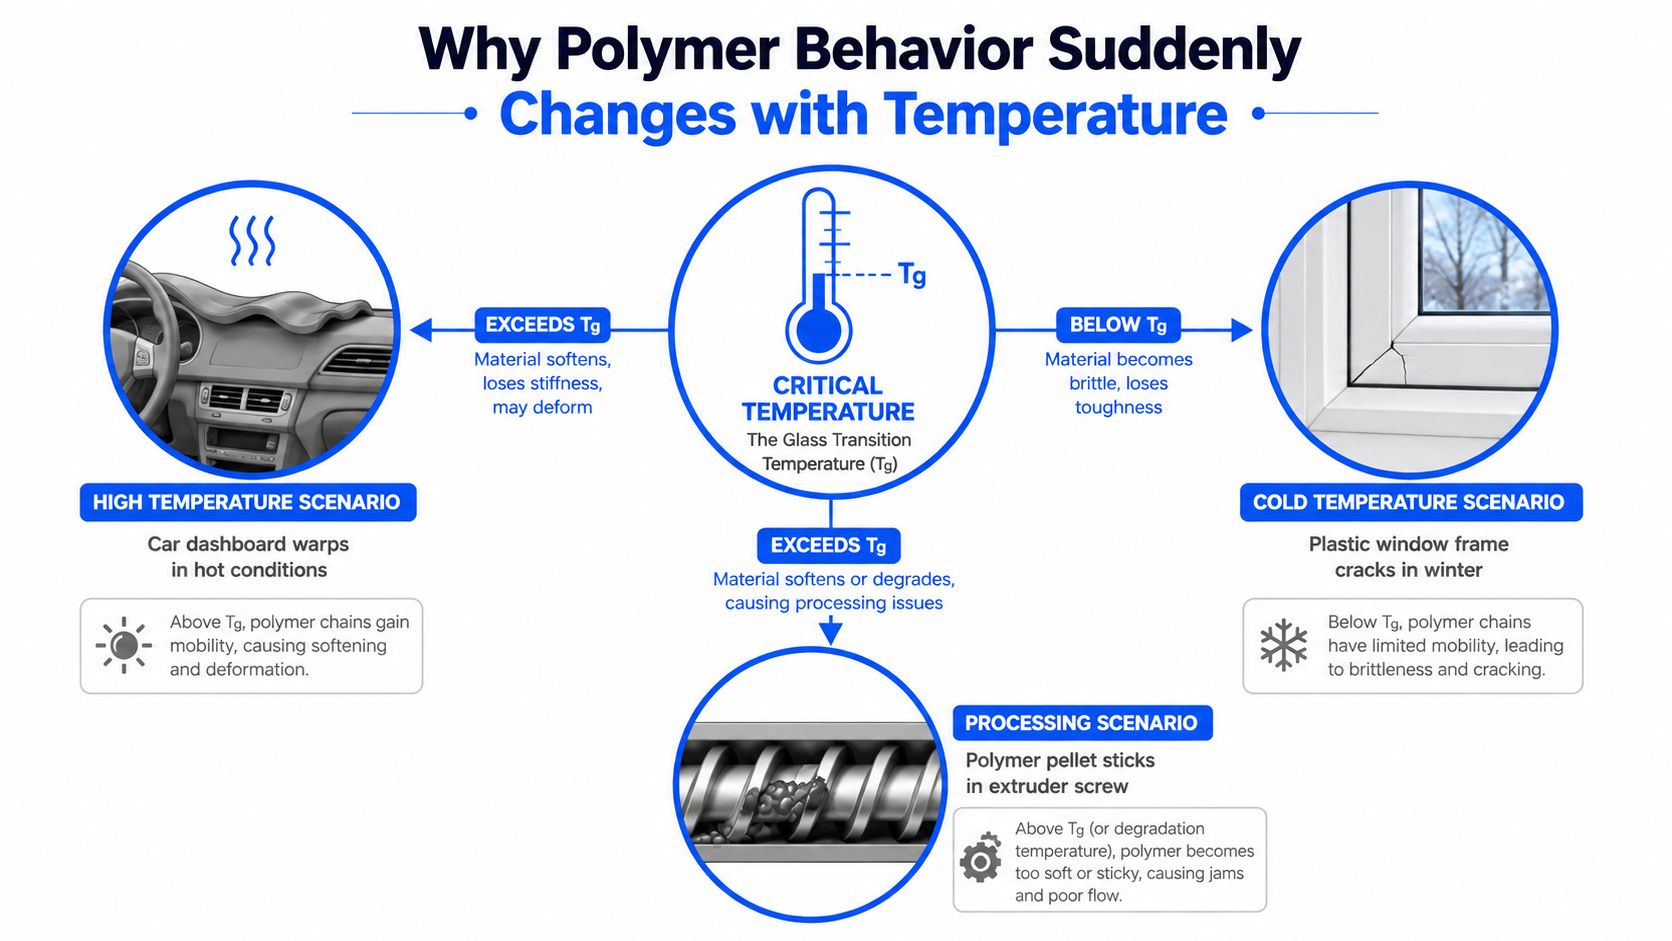
If you've ever seen a part warp on a hot dashboard, crack in winter, or refuse to extrude cleanly, you've already met Tg in the lab's less forgiving form. The confusion starts because people talk about Tg like it's a single number, when in practice it's better understood as a method-dependent window that reflects how fast the polymer's segments can move on the timescale you're probing.
Table of Contents
Why Polymer Behavior Suddenly Changes with Temperature
A formulator chooses a resin for a warm enclosure, the part comes back from molding looking fine, then the first heat cycle turns it soft enough to creep. That failure usually points to glass transition temperature, or Tg. Once you know where Tg sits, you can see why a polymer that feels solid on Friday can behave like a different material on Monday.
Why the number is a range
Tg is not a melting point. It is an operationally defined transition, historically tied to a relaxation time of about 100 s, and in some newer work to 1000 s for the α-relaxation of a supercooled liquid. The practical meaning is simple, the observed value depends on how the material is tested, how fast it is heated, and how long the structure has to relax.
That is why the same polymer can show different Tg values in different sources. A quick DSC scan, a DMA run, or a slower relaxation study are not measuring identical behavior, even when they all use the word Tg. Engineers care about that nuance because they need a design Tg, not a textbook label.
Practical rule: if a part has to keep its shape under load, do not ask only whether the polymer has a Tg. Ask whether the Tg was measured in a way that matches the stress, strain, and thermal history your part will actually see.
What problem Tg solves
Tg gives teams a way to predict when a polymer will stop behaving like a stiff glass and start behaving like a softened solid with mobility in the chains. That is why it shows up in packaging, automotive interiors, electronics housings, coatings, and processing windows. It tells you whether a resin will still hold modulus, whether it will creep, and whether it will process cleanly during manufacturing.
It is tempting to treat Tg as a fixed property like density. That shortcut breaks quickly in real development work. Tg is a design knob, and the rest of the formulation, test method, and thermal history determines where that knob appears on the report.
The Molecular Picture Behind Tg
What is happening inside a polymer when it reaches Tg? At the molecular level, the chains are not melting, and they are not suddenly becoming liquid. They are gaining enough local freedom for neighboring segments to move together, so the material shifts from frozen, glassy behavior toward mobility that shows up in both mechanics and thermal response. That is why Tg appears as a change in stiffness and heat capacity instead of a sharp phase boundary, as described in thermal analysis and ΔCp behavior.
Free volume and segmental motion
A useful mental model is cold noodles. When they are cold, the strands cling together and resist motion. As they warm, they loosen, slide, and bend more easily. Polymer chains behave in a similar way, except the “loosening” comes from enough free volume and thermal energy for neighboring segments to reorganize.
Free volume is the small amount of empty space between chain segments. As temperature rises, that space grows enough for short stretches of the backbone to move cooperatively. The motion is local, not whole-chain flow. That distinction matters, because the part may still look solid while its molecular segments are already becoming more mobile.
Tg therefore belongs to a kinetic picture rather than a single equilibrium point. The material does not change at one universal temperature. It reaches the temperature range where motion becomes visible on the timescale of the test you are running. A slower experiment gives the segments more time to respond, so the reported Tg can shift, and that is why R&D teams need to match the measurement method to the question they are asking.
Why DSC sees a step, not a spike
In thermal analysis, Tg usually shows up as a step change in heat capacity, ΔCp, with a baseline shift rather than a sharp peak. The reason is straightforward. As the chains begin to participate in cooperative motion, the material needs a different amount of energy to keep rising in temperature. It is not absorbing latent heat the way it does at melting. It is changing how it stores and dissipates energy as mobility increases.
That is why a DSC curve around Tg often looks like a change in the line instead of a dramatic event. The instrument is detecting a change in response, not a sudden break in structure.
Tg is the temperature range where motion becomes slow enough to matter to the instrument, but fast enough to matter to the part.
Recent molecular analysis of Tg also points in the same direction. Researchers have used signatures such as dihedral-angle distributions and ergodicity breaking to describe how motion turns on at the molecular level, which fits the same operational view from a different angle (recent molecular analysis of Tg). For formulation work, that matters because it links structure, measurement method, and property prediction. Teams can use the molecular picture to choose a test that matches the application, estimate how composition may move Tg up or down, and speed screening with AI-guided tools that learn from structure-property data.
Tg Versus Tm and What Each Transition Tells You
Why do polymer datasheets list both Tg and Tm? Because they describe different kinds of change, and each one answers a different design question. Tg marks the mobility threshold of amorphous regions. Tm marks the melt transition of crystalline regions. In polymers that contain crystallites, Tg sits below Tm because the glassy state is still a higher-energy arrangement than the crystal.
| Aspect | Glass Transition (Tg) | Melting (Tm) |
|---|---|---|
| Physical meaning | Segmental motion turns on in amorphous regions | Crystalline lattice breaks down |
| Observable change | Heat capacity step, stiffness change | True melt, loss of crystalline order |
| Material state | Glassy to rubbery | Solid crystal to liquid-like melt |
| Design relevance | Stiffness, creep, damping, service temperature | Melt processing, crystallinity, thermal form stability |
PET is a useful example because it shows both transitions in the same material. Standard references place PET around 70°C for Tg and describe its broader commercial use because it also has a separate melting transition (PET Tg range and related polymer values). That dual behavior is common in semicrystalline plastics, where the amorphous fraction and the crystalline fraction each contribute to performance in different ways.
The design lesson is straightforward. Tg tells you when a part begins to relax and lose glassy stiffness. Tm tells you when a crystalline polymer melts. For a rigid housing, Tg is usually the first property to check because it sets the temperature range where the part still behaves like a solid glass. For extrusion or injection molding, Tm matters because it defines the processing window for the melt.
How Tg Is Measured in the Lab
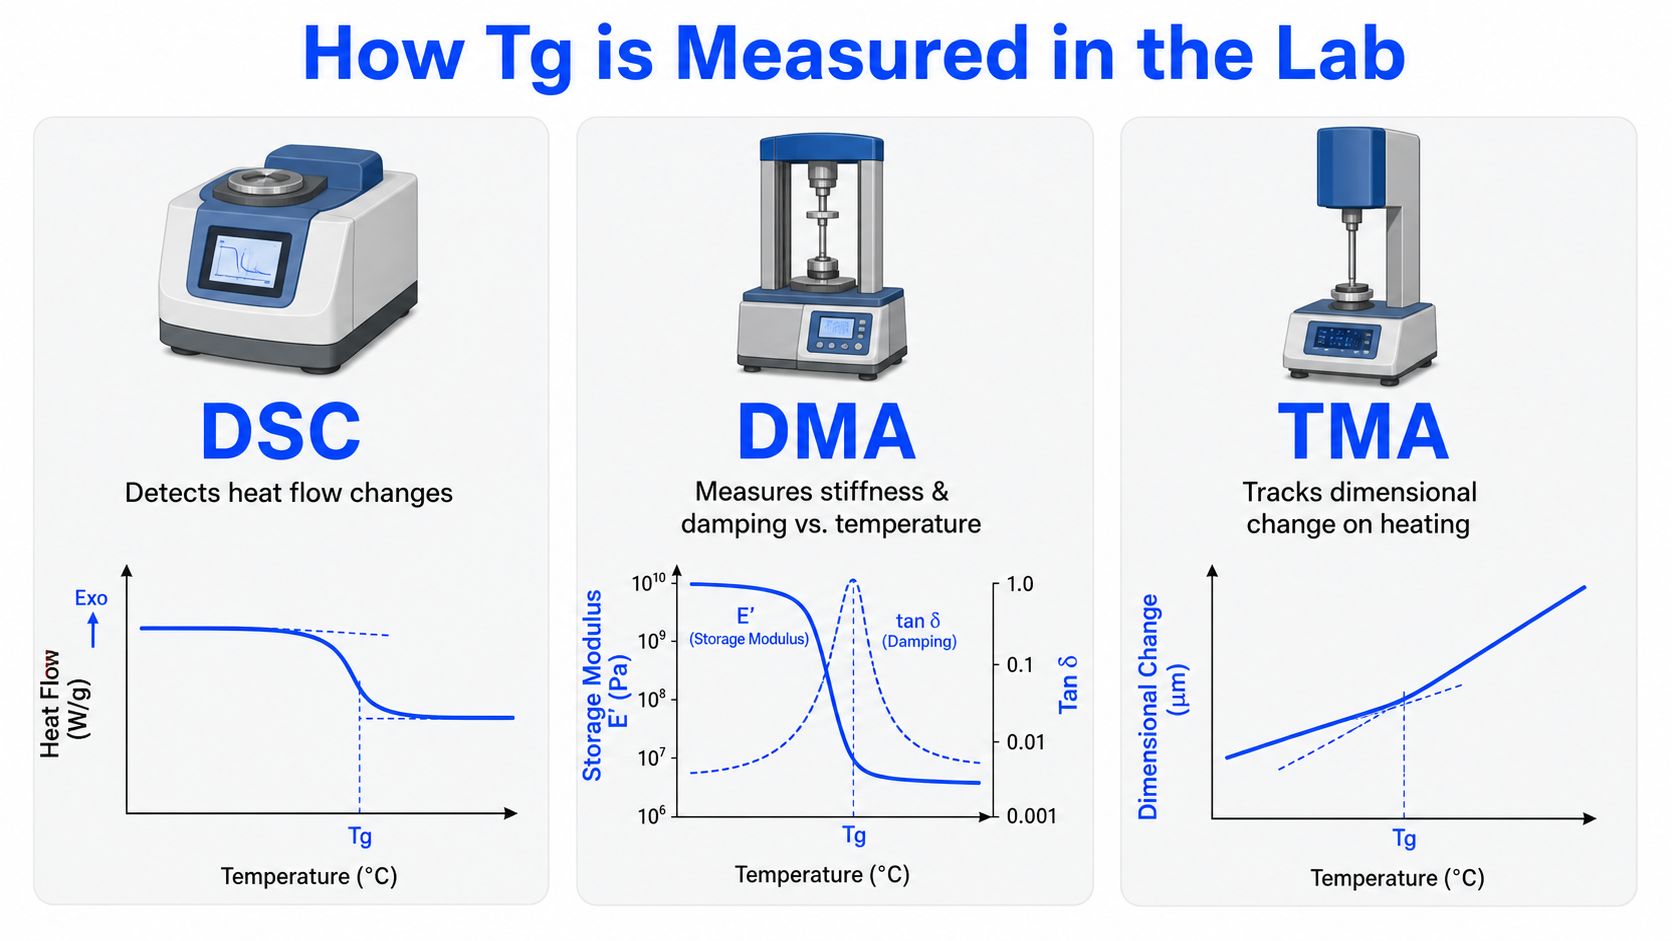
Three instruments do most of the work here, and each one tells a slightly different story. DSC, DMA, and TMA all detect the transition, but they respond to different signals, so they answer different engineering questions.
What each method really measures
DSC tracks heat flow. Near Tg, the key sign is a step change in heat capacity and the shifted baseline that comes with increased molecular mobility (polymer Tg reference values). DMA applies a deformation and watches stiffness and damping, so Tg often appears as a peak in the damping response or a drop in storage modulus. TMA looks at dimensional change, which is useful when you care about expansion, shrinkage, or softening under load.
The method matters because these are not interchangeable signals. A polymer can appear to reach Tg earlier in DSC and later in DMA, because DMA is responding to mechanical relaxation under a specific loading mode and timescale. That is one reason the same resin can seem to have more than one Tg.
Which method to ask for
Use the method that matches the property you care about. If you need a thermal fingerprint for formulation screening, DSC is often the first pass. If you care about stiffness retention, damping, or vibration response, DMA is usually more informative. If your risk is warpage or dimensional drift, TMA deserves a look.
Lab reality: heating rate, sample history, and prior thermal cycling can all shift the apparent Tg. The question is not just “what is the Tg?”, it is “what is the Tg under this test protocol, for this specimen, with this thermal history?”
That is why good labs document the method, the scan rate, and the conditioning history alongside the number. Without that context, Tg becomes hard to compare and easy to misuse.
Molecular Levers That Move Tg Up or Down
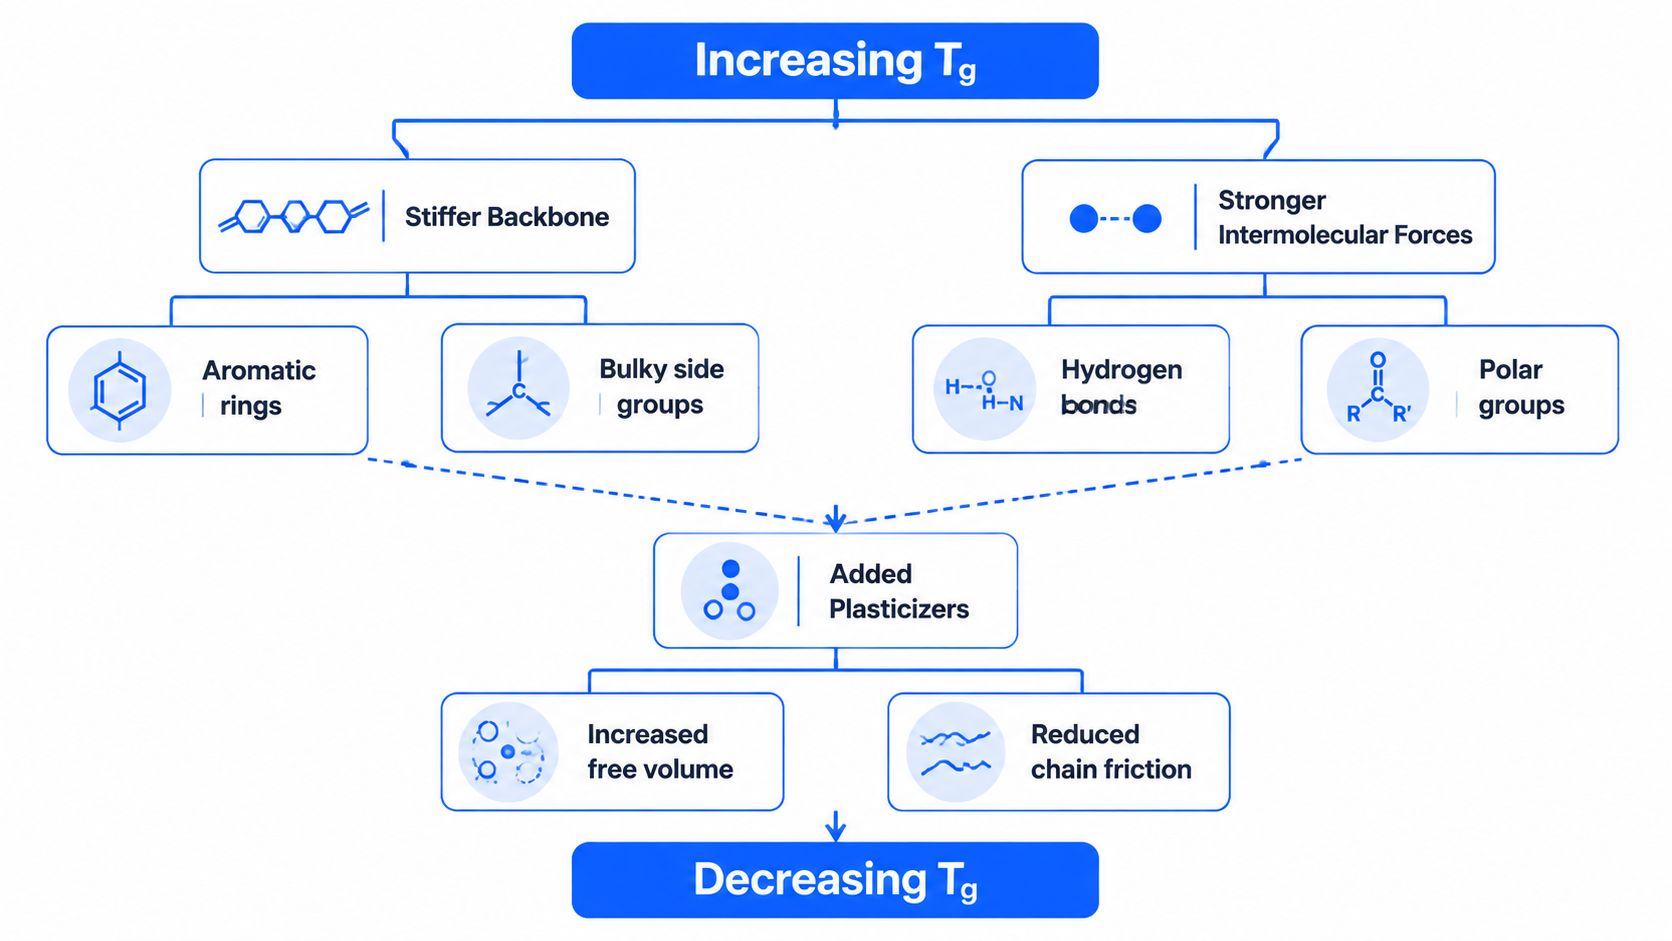
Chemists don't “set” Tg by decree, they tune it by changing how easily chains can move. The most common levers are familiar, but the direction of the effect matters more than the label on the additive bottle.
Ways to push Tg up
A stiffer backbone raises Tg because the chain resists local motion. Aromatic rings and bulky side groups make that motion harder, which is why materials like polycarbonate sit much higher than flexible-chain polymers. Stronger intermolecular forces also push Tg upward because hydrogen bonding and polar interactions increase chain friction.
Crosslinking does the same thing by tying chains together. Once enough links exist, motion has to happen within a more constrained network, so the transition shifts higher. That's one reason heavily crosslinked epoxies can tolerate much hotter service than uncrosslinked thermoplastics.
Ways to pull Tg down
Plasticizers do the opposite. They wedge between chains, increase free volume, and reduce friction, which lowers Tg. That's why plasticized PVC becomes flexible enough for hose, cable insulation, and soft vinyl products, while unplasticized PVC stays much more rigid. The same logic applies when you add a more flexible comonomer in a random copolymer.
Low molecular weight also tends to lower Tg because chain ends act like internal plasticizers until the entanglement limit is reached. Tacticity matters too. The arrangement of side groups changes packing efficiency, so isotactic, syndiotactic, and atactic versions of the same monomer can behave very differently.
For R&D teams, the key point is straightforward. Every formulation choice is also a Tg choice. If you want a hotter service window, you stiffen the chain or restrict motion. If you want flexibility, you add mobility and free volume. The art is picking which lever moves Tg without breaking the other properties you need.
Reading a Tg Value in Real Design Decisions
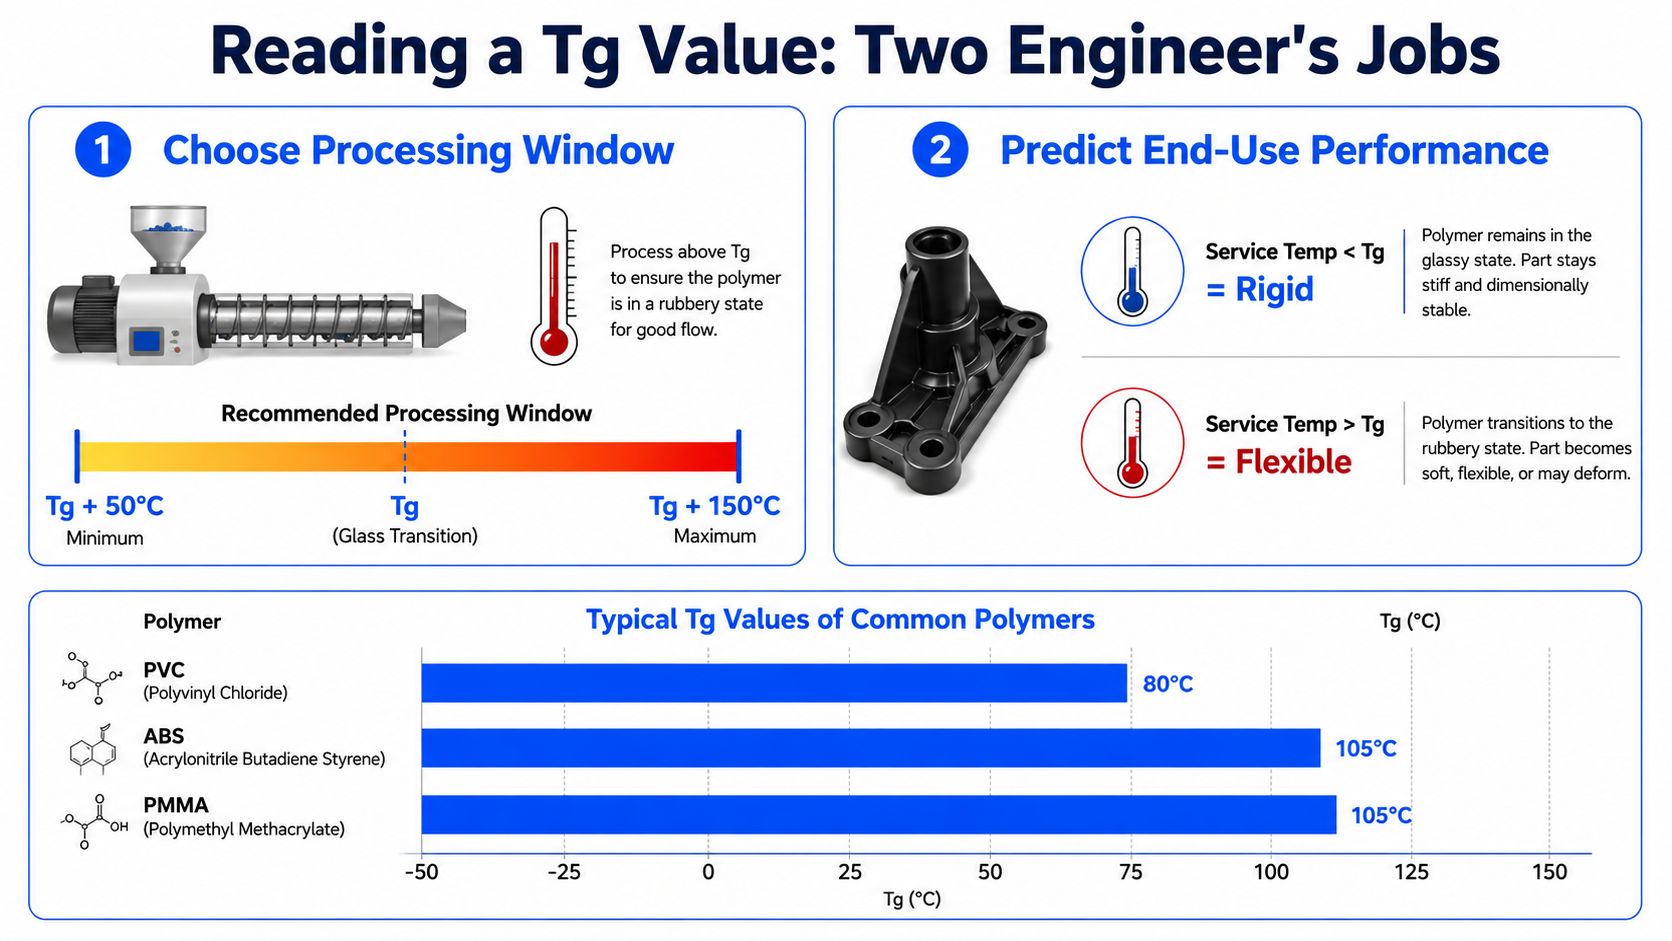
What does a Tg value tell you when you are choosing a polymer for a real part? The answer depends on service temperature, load, and the time scale of use. The same Tg can mean “safe and rigid” in one design and “softening risk” in another. Engineers usually use Tg for two practical questions, selecting a processing window and anticipating end-use behavior. polymer Tg reference values
Common polymers and what their Tg says
LDPE and HDPE sit around -100°C, so they are already well above Tg at room temperature and stay flexible in everyday use. PP is about -25°C, so it remains relatively flexible at room conditions but can stiffen in colder environments. PET around 70°C, PS around 95°C, ABS around 100°C, and PC around 149°C show the move toward rigid, heat-resistant behavior in consumer and engineering plastics, as reflected in common reference values.
Those values explain familiar material choices. Polystyrene feels brittle in many room-temperature uses because it sits near its glassy region. ABS usually outperforms PS in impact because the formulation is tuned toward tougher real-world behavior. Polycarbonate survives hotter electronics because its Tg is high enough to preserve stiffness where many commodity plastics would soften.
How to use the number
Tg acts like a ceiling for rubbery behavior and a floor for stiffness. If a rigid plastic runs above its Tg under load, creep and modulus loss become more likely. If a flexible material is used far below Tg, brittleness and poor impact resistance become more likely.
That is why a Tg value should be read as an operational range, not a single point in isolation. A DSC scan, a DMA test, and a practical service condition can point to slightly different apparent transitions because motion depends on timescale and method. For R&D teams, that nuance matters. It helps decide which measurement to trust for a given application, how to estimate Tg from structure before synthesis, and where AI-guided property prediction can shorten the search for a better formulation.
Choose a material with a service window that keeps the end-use temperature comfortably on the side of Tg you actually need.
That does not mean one universal margin works for every resin. It means the safe choice depends on whether the part is meant to stay stiff, damp vibration, flex repeatedly, or survive a molding cycle without distortion. The design question is not just where Tg sits on paper, but how the polymer behaves under the thermal and mechanical history of the actual part.
Predicting Tg From Structure and From Data
The oldest way to predict Tg is still useful. Chemists use empirical relationships such as the Fox equation and the Gordon–Taylor fit for copolymers, then pair that with group-contribution thinking to estimate Tg from a drawn structure. These approaches work because they encode the same idea you'd use at the bench, stiffness, intermolecular forces, and mobility all push Tg in measurable directions.
What model-based prediction is good at
If you already know the repeat unit, these methods can narrow the search before you synthesize anything. That's valuable in formulation work, where hundreds of combinations can look promising on paper and only a handful deserve a lab run. A prediction doesn't replace measurement, but it can spare you a lot of dead-end screening.
Modern AI and machine learning push that logic further by learning from curated datasets. Models trained on polymer structures can estimate Tg from SMILES strings or fingerprints, but the result is only as good as the data behind it. Conjugated and high-performance polymers are still underrepresented in many public datasets, so prediction confidence should be treated carefully.
Polymerize Labs fits into that workflow as one option among several for AI-driven formulation and property prediction, including Tg estimation from polymer structure. Used well, this kind of system helps R&D teams shortlist candidate chemistries faster, then verify the winner with the right experimental method before scale-up.
Where prediction still needs lab confirmation
Prediction is strongest when it narrows a design window, not when it substitutes for validation. If the application is sensitive to service temperature, damping, or cure state, you still want the measured Tg under the conditions that match the final part. That's especially true when the sample's history, crosslink density, or crystallinity can shift the apparent result.
The most practical workflow is a hybrid one, predict first, measure second, then refine the model with the new data. That's how teams build a faster feedback loop without losing confidence in the number they hand to manufacturing.
Choosing the Right Tg for Your Next Experiment
The common mistake is asking for the Tg of a material as if one number settles the question. It doesn't. A thermal probe, a mechanical probe, and a dielectric or dimensional probe can all return different values on the same sample because each one is tied to a different timescale and loading mode.
The better question is simpler and more precise. Which Tg, measured how, under what conditions, predicts the property I care about? If you care about creep, choose the method that tracks mechanical relaxation. If you care about softening during a heat cycle, choose the thermal method that matches your process. If you're trying to screen candidates before synthesis, use prediction to narrow the list and then confirm with the test that matches the end-use stress.
For your next experiment, keep the sequence tight. Define the service temperature window, choose the measurement method that reflects the deformation mode, use structure-based prediction to shortlist candidates, and validate with the right lab protocol. Tg is powerful when you treat it as a range tied to method and timescale, not as a number to memorize.
If you're building a Tg-driven formulation workflow, Polymerize can help you combine experimental history, explainable property prediction, and candidate screening in one system. Visit Polymerize to see how teams use AI-guided materials data to shortlist chemistries and validate them with the right measurements.
Put your R&D data to work
See how materials teams use Polymerize to plan fewer experiments and reach target properties faster.