



“Just adjust the setpoint” is among the most persistent pieces of advice in polymer processing, and it's often wrong. A viscosity reading doesn't tell you why a material flows differently. It only reports the combined result of molecular weight, temperature, shear history, moisture, solids, architecture, and chemical change.
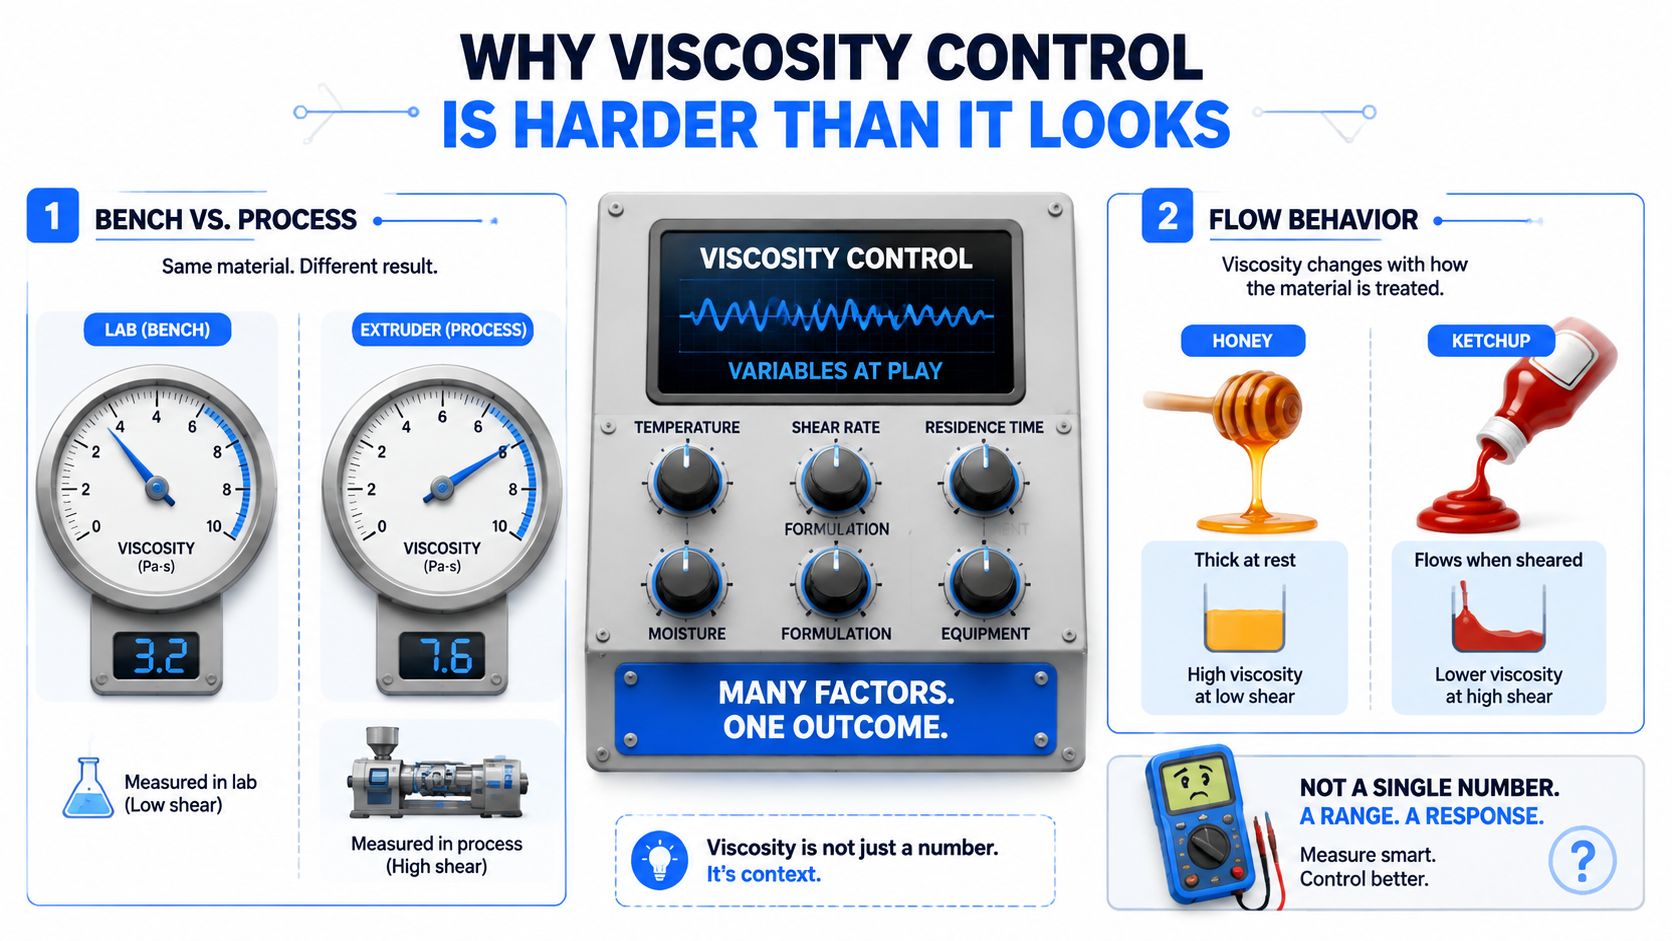
That distinction matters at the bench and on the plant floor. A resin that looks too thick in a beaker may process correctly through an extruder, while a coating that flows perfectly during a low-shear laboratory test may sag after application. Effective viscosity control starts with diagnosis. You need to identify which material state or process condition produced the reading before changing the recipe or operating conditions.
Table of Contents
- A viscosity value has no meaning by itself
- The molecular cause matters more than the numerical symptom
Why Viscosity Control Is Harder Than It Looks
A viscosity value has no meaning by itself
Viscosity is resistance to flow, but the measured value depends on how the material is being deformed. Shear rate, temperature, geometry, and prior processing all influence the result. A spindle viscometer, a capillary rheometer, and an extrusion die can therefore produce different, valid descriptions of the same formulation.
A polymer melt also carries memory. Chains can align under shear, relax after processing, form temporary networks, or degrade under heat and mechanical stress. A low reading may indicate dilution, chain scission, moisture-driven hydrolysis, or incomplete polymerization. A high reading may point to increased molecular weight, gel formation, undispersed solids, impurities, or partial phase change.
Practical rule: Treat every viscosity reading as a symptom, not a diagnosis.
This is why a fixed setpoint can create false confidence. The target must correspond to the application's actual flow regime. Extrusion requires information at high shear, coatings often depend on low-to-moderate shear and recovery, and storage stability may depend on yield stress or viscoelastic structure rather than one apparent viscosity value.
The molecular cause matters more than the numerical symptom
A formulation change that corrects one cause can worsen another. Adding solvent may reduce viscosity, but it can also alter solvent quality, polymer conformation, drying behavior, and final performance. Heating may make a material easier to pump, yet it won't repair hydrolysis, crosslinking, or poor dispersion.
The industrial stakes are substantial. Viscosity directly affects mechanical properties, dimensional stability, and surface finish in polymer extrusion. A 2025 University of Manchester study described a nonlinear model predictive control framework that held melt viscosity within ±2% of its setpoint, with settling times below 20 seconds, and restored the target after ±100 Pa·s step disturbances in under 18 seconds (University of Manchester study on melt viscosity control). The result is important not because every plant should copy the same controller, but because it demonstrates the value of controlling viscosity as a material-state variable.
The practical vocabulary comes from rheology, measurement, molecular design, and process history. Once those pieces are connected, troubleshooting becomes a causal exercise instead of trial and error.
The Rheology Concepts You Actually Need
Start with flow, not formulas
Think of viscosity as internal friction. Water offers little resistance when it flows, while honey resists motion because its molecules dissipate more energy as they move past one another. A Newtonian fluid keeps roughly the same viscosity as shear changes, provided temperature and composition remain stable. Simple oils and water are familiar approximations.
Polymer formulations are often non-Newtonian. Their apparent viscosity changes with shear because chains orient, networks deform, particles interact, or structures break apart. Latex paint becomes easier to spread under a brush, and a polymer melt can flow more readily through a die than it does at rest.
Shear-thickening systems behave in the opposite direction. Highly filled suspensions can become more resistant to flow as particles crowd and interact under stress. The important point is that a single viscosity number hides this behavior.
Yield stress and viscoelasticity explain practical failures
A material with yield stress behaves as though it has a weak internal structure. It won't move appreciably until applied stress exceeds that structure's strength. Ketchup illustrates the idea: the bottle can sit without flowing, then the contents move after sufficient squeezing. Tile adhesives and some filled coatings use this behavior to remain in place before application.
Viscoelastic materials combine liquid-like and solid-like responses. A dashpot represents viscous dissipation, while a spring represents elastic storage. Polymer melts, gels, and hot-melt adhesives show both responses, so they can flow under sustained force yet recoil after deformation.
| Concept | Everyday analogy | Polymer or formulation example |
|---|---|---|
| Newtonian viscosity | Water from a faucet | Simple oil-like fluid |
| Shear-thinning | Ketchup spreading after squeezing | Screen-printing paste |
| Yield stress | A thick sauce staying in a bottle | Tile adhesive |
| Viscoelasticity | A spring combined with a slow-moving piston | Hot-melt adhesive strand |
The same formulation can be easy to pump, stable in a container, and resistant to sagging because it expresses different rheological properties under different conditions. Viscosity control therefore requires matching the test to the failure mode. If the complaint is settling, measure structure and yield behavior. If it's die pressure, measure high-shear flow. If it's stringing, examine elastic recovery.
How Viscosity Is Measured in Practice
No instrument captures the entire rheological profile. Each tool answers a different process question, and trouble begins when a simple instrument gets used to answer a complex one.
A capillary rheometer forces a melt through a die and calculates flow behavior under high shear. That makes it useful for extrusion and injection-molding decisions, where pressure, throughput, and die geometry impose strong deformation. It can reveal shear-thinning that a low-shear batch test won't show.
A rotational rheometer with cone-and-plate or parallel-plate geometry covers low-to-moderate shear conditions. It's better suited to coatings, inks, dispersions, and structured fluids. The operator can measure flow curves, recovery after shear, and, with oscillatory testing, the balance between elastic and viscous response.
Brookfield-type spindle viscometers remain useful for routine batch release and trend tracking. They're straightforward and practical, but the result is tied to the spindle, speed, temperature, and sample condition. A single reading can't reliably characterize yield stress, thixotropy, or viscoelasticity.
Oscillatory rheology applies a small deformation and measures the resulting response. The storage modulus, G', reflects elastic behavior, while the loss modulus, G'', reflects viscous dissipation. This method helps distinguish a weak gel from a concentrated liquid, particularly in cured systems and dispersions.
Rheometry Methods at a Glance
| Method | Regime | Best For |
|---|---|---|
| Capillary rheometer | High shear, flowing melt | Extrusion and injection-molding behavior |
| Cone-and-plate rheometer | Low to moderate shear | Coatings, inks, and formulation flow curves |
| Parallel-plate rheometer | Low to moderate shear, adaptable structure | Dispersions, gels, and soft solids |
| Brookfield-type viscometer | Defined single operating condition | Batch release and trend monitoring |
| Oscillatory rheometer | Small-amplitude deformation | Gels, cured systems, elasticity, and structure |
A process-viscometer offers a different advantage: continuous observation. Anton Paar's process-viscometer guidance describes process measurement as providing viscosity values 24 hours a day, 7 days a week, allowing constant monitoring or control instead of relying only on laboratory testing. In high-volume polymer production, that continuity matters. A 2009 industrial PET study described large-scale lines operating at 800 to 1000 tons per day by mid-2003, with about 60% of global PET output used for synthetic fibers and around 30% for bottles (industrial PET polymerization study).
Molecular and Formulation Levers That Move Viscosity
Change the polymer before reaching for dilution
Molecular weight is usually one of the strongest levers for zero-shear viscosity. Longer chains create more entanglements, so increasing molecular weight can raise resistance to flow sharply. Molecular-weight distribution matters too. A broader distribution may improve processability in some systems while changing the high-shear response and elasticity.
Architecture changes flow without necessarily changing the chemical identity of the repeat units. Linear, branched, star, comb, and bottlebrush structures arrange chain segments differently. A review of comb and bottlebrush polymers links backbone length, side-chain length, branching density, and grafting architecture to changes in zero-shear viscosity, strain hardening, and plateau shear modulus (review of comb and bottlebrush polymer rheology).
That gives the formulator several distinct options:
- Molecular weight and distribution: Increase chain entanglement and low-shear viscosity, while also influencing elasticity and processability.
- Chain architecture: Use branching or grafting to reshape shear response, recovery, and strain hardening rather than just making the material thicker everywhere.
- Solvent quality: A good solvent expands polymer coils, while a poorer solvent contracts them and can promote association or precipitation.
- Solids loading: More polymer or particulate content generally raises flow resistance, but dispersion quality determines whether the increase is controlled or erratic.
- Filler geometry: Spherical particles and high-aspect-ratio fibers build different networks. Polymer and silica nanocomposites can reduce or reshape viscosity depending on composition and particle interactions.
- Plasticizers: Lower chain interactions and glass-transition behavior, often reducing viscosity, though compatibility and migration remain critical.
- Associative thickeners: Reversible hydrophobic associations can raise low-shear viscosity and create useful shear-thinning, but their response depends on surfactants, solvents, and polymer concentration.
Separate level from shape
Some levers mainly move the zero-shear viscosity, the near-rest resistance to flow. Molecular weight, solids, and solvent quality often belong here. Other choices mainly alter the shape of the flow curve, including architecture, associative groups, and thickener chemistry.
| Lever | Primary Rheological Effect | Typical Magnitude |
|---|---|---|
| Molecular weight | Raises zero-shear viscosity and entanglement | System-dependent |
| Molecular-weight distribution | Balances processability and elasticity | System-dependent |
| Branching or grafting | Changes strain hardening and shear response | System-dependent |
| Solvent quality | Changes chain expansion and association | System-dependent |
| Solids loading | Raises resistance and may create structure | System-dependent |
| Filler aspect ratio | Builds or reshapes particle networks | System-dependent |
| Plasticizer | Reduces intermolecular resistance when compatible | System-dependent |
| Associative thickener | Raises low-shear structure and shear-thinning | System-dependent |
Avoid assuming that a low-shear adjustment will behave independently at high shear. A thickener may create strong stand-up viscosity while thinning dramatically during application. A branched polymer may improve melt strength but increase die pressure. The right question is not “Which ingredient gives the target number?” It's “Which molecular mechanism gives the required flow profile?”
Process Variables That Quietly Reshape Rheology
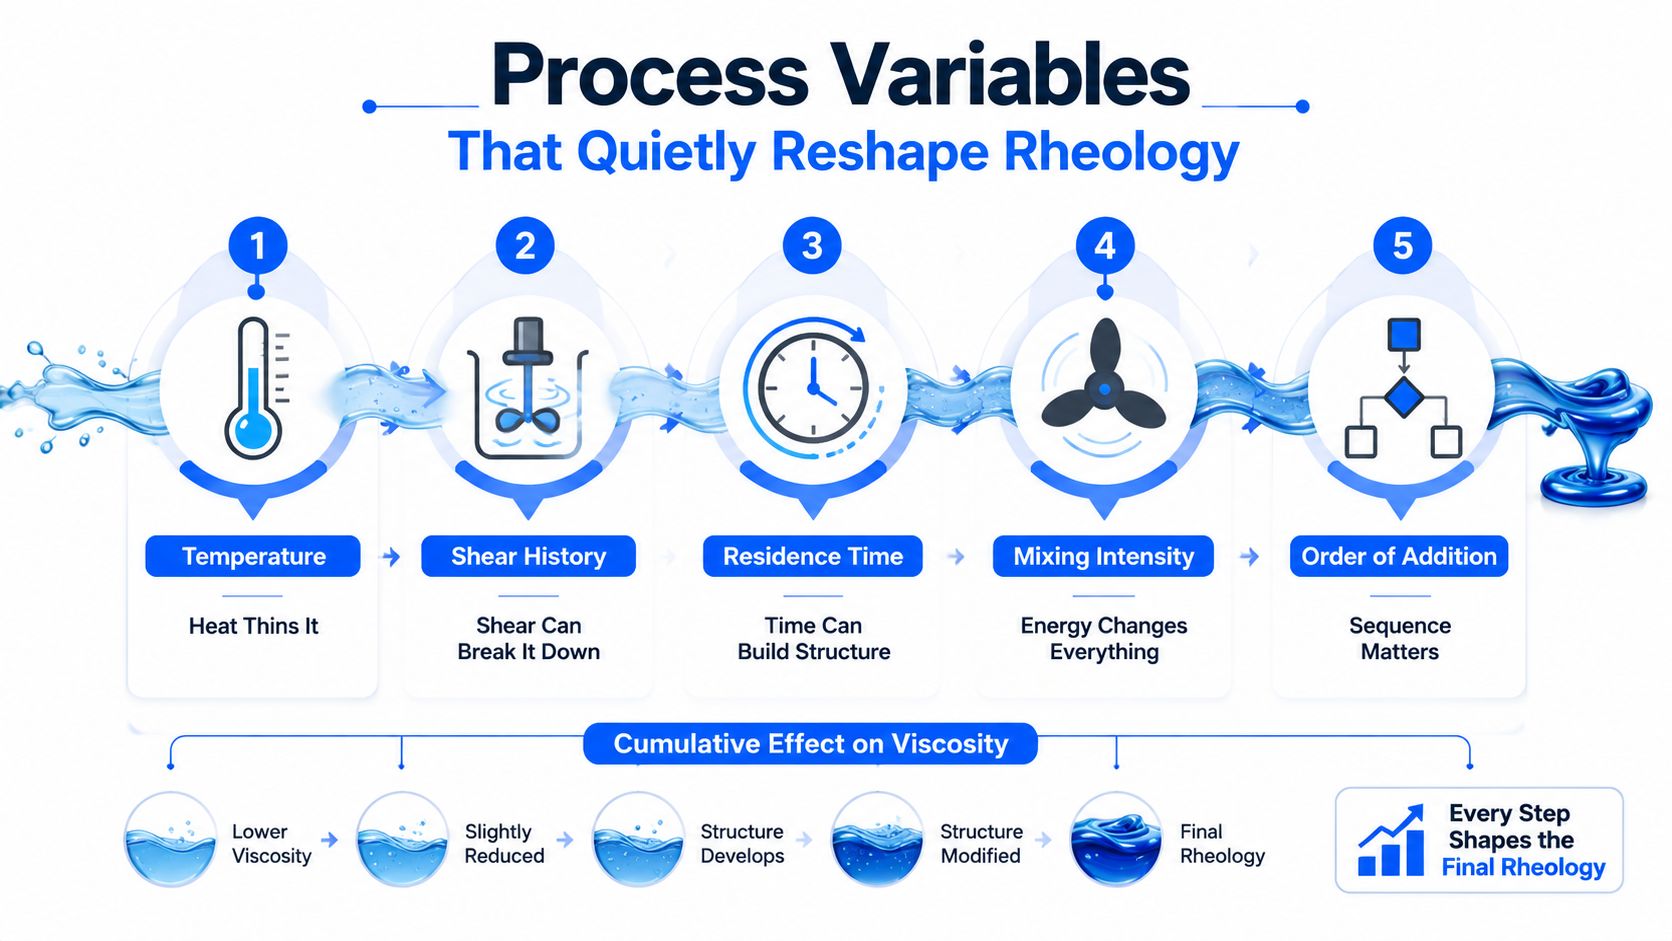
A recipe can remain unchanged while the material becomes measurably different. Temperature, shear, residence time, mixing energy, and addition sequence all alter chain conformation, dispersion, reaction progress, and structure recovery.
Temperature is the most obvious variable, but operators often track jacket temperature rather than the material's actual temperature. Near a polymer's glass-transition region, a relatively small temperature change can produce a large viscosity response. High-speed mixing can also create local heat that the tank sensor misses.
Shear history creates a second hidden variable. Temporary shear-thinning can reverse when chains relax or a network rebuilds. Permanent viscosity loss is different. In polymeric lubricants, high-molecular-weight viscosity index improvers can align under severe shear, producing temporary thinning, or fracture and cause permanent loss of viscosity and oil-film thickness. Industry guidance notes that engine-critical shear rates can exceed 10^6 to 10^7 s^-1, and ASTM D6278 evaluates durability through the Shear Stability Index, where lower SSI indicates better resistance to permanent loss (viscosity index improver and shear stability guidance).
Read the signature, not just the result
Residence time can allow hydrolysis, oxidation, curing, association, or structure rebuilding. Condensation polymers may lose chain length in the presence of heat and moisture. Poor nitrogen blanketing can enable oxidative chain scission. In waterborne systems, contamination can change viscosity over storage.
Mixing intensity and addition order determine whether particles disperse, polymers hydrate, and associative groups connect in the intended sequence. Adding a thickener before wetting the solids can create lumps that later look like unexplained high viscosity. Adding a reactive component too early can start a cure or gel process inside the tank.
A sudden viscosity drop immediately after a high-shear step points toward mechanical damage or structure breakdown. A gradual drift over hours points more strongly toward temperature, reaction, moisture, oxidation, or biological change.
Track viscosity at consistent temperature and at more than one shear condition. That simple time-resolved record often separates a reversible process effect from a permanent molecular change.
Troubleshooting When Viscosity Goes Wrong
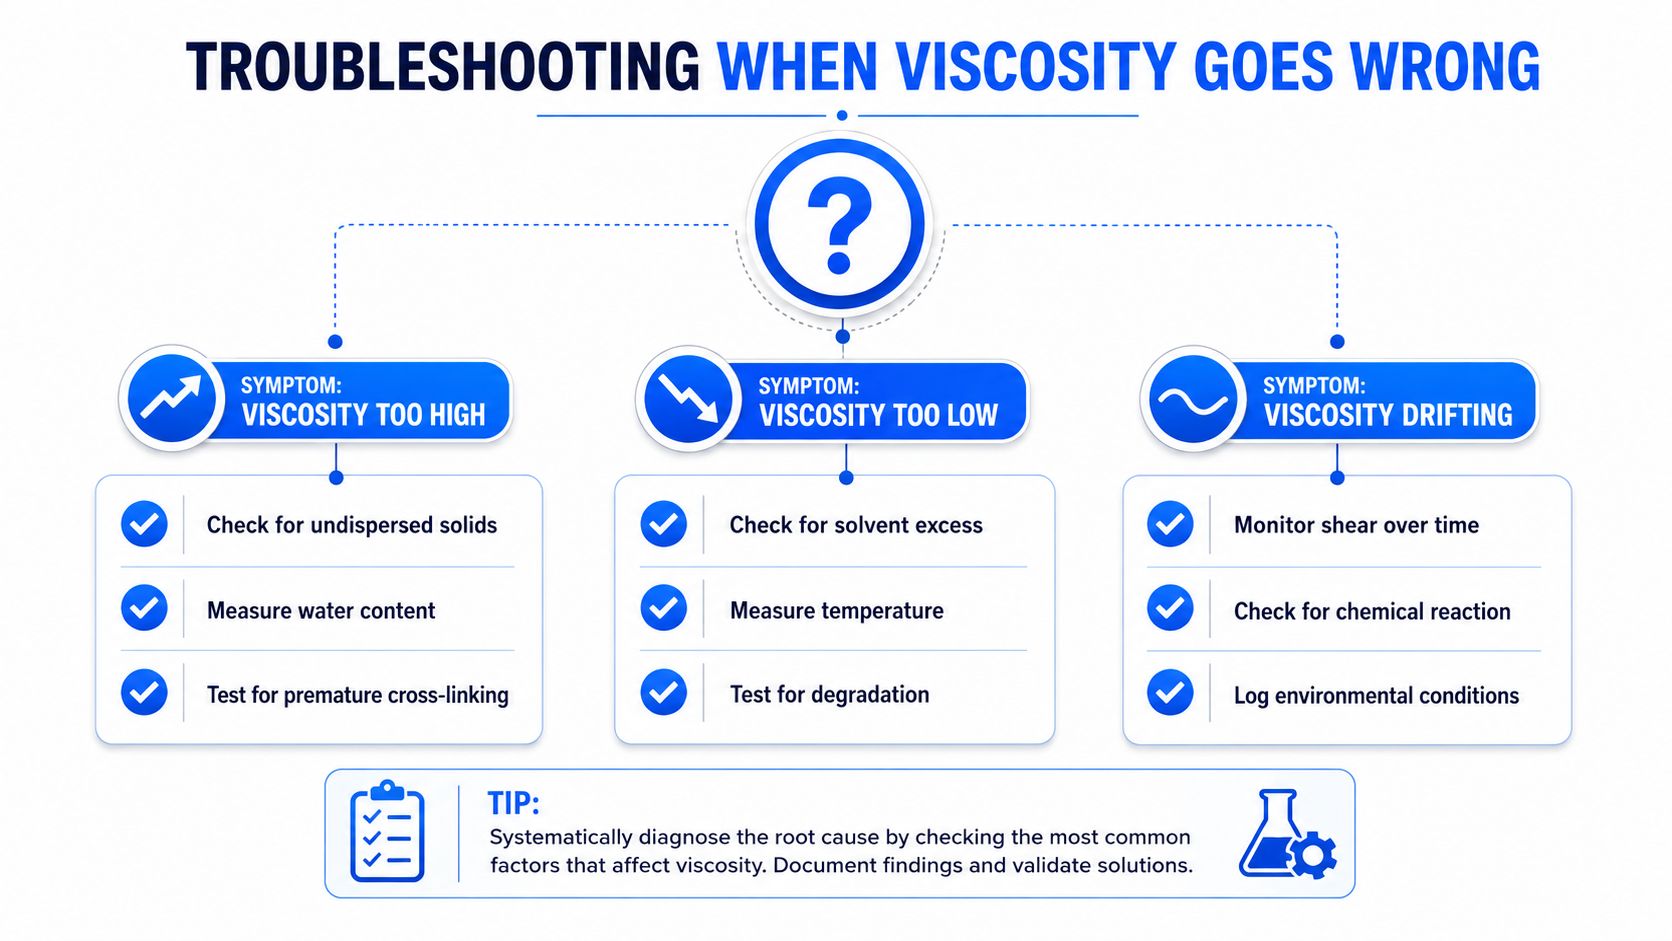
The fastest investigation starts by preserving the symptom. Don't immediately dilute, heat, or add more thickener. First confirm the measurement temperature, instrument, spindle or geometry, sample preparation, and time since sampling.
When viscosity is too high
Begin with the cheapest reversible checks:
- Check temperature: Compare actual sample temperature with the specification. A colder sample can appear high without any formulation change.
- Inspect dispersion: Look for undispersed solids, agglomerates, skin, or gel particles. A poor dispersion can raise apparent viscosity and create large sample-to-sample variation.
- Check composition: Use solids measurement or loss-on-drying to determine whether solvent or water was lost.
- Investigate molecular change: If composition is correct, use GPC to examine molecular weight and distribution.
- Test for network formation: Sol-gel behavior, insoluble material, or unusual elasticity can indicate premature crosslinking, gel formation, or phase separation.
A high result paired with strong elastic response suggests structure, not simple concentration. A high result that falls quickly under shear may indicate a weak network or thixotropic system.
When viscosity is too low
Low viscosity also has several plausible causes. Check for excess solvent or water first, then verify that every thickener, resin, catalyst, and reactive component was added in the intended amount. Moisture can be especially important in systems vulnerable to hydrolysis.
Residual acid or base may change polymerization, association, or cure state. If the batch experienced heat or extended hold time, compare molecular weight against an approved reference. A reduced molecular weight supports degradation, while unchanged molecular weight with altered low-shear behavior may indicate disrupted physical structure.
When viscosity keeps drifting
Drift requires a time series. Record tank temperature at different locations, sampling time, agitation state, oxygen exposure, and elapsed hold time. Then check residual catalyst, moisture, hydrolysis, oxidation, and, where relevant, microbial growth in waterborne formulations.
Storage history deserves equal attention. Poly(amic acid) guidance associates room-temperature storage with viscosity loss from hydrolysis and chain degradation, and recommends low-temperature storage with minimal hold time (poly(amic acid) viscosity support guidance). The lesson is operational: shelf life, transfer lines, and tank residence belong inside the viscosity-control plan.
Every batch should carry a compact structured record:
- Recipe identity: Formula version, target solids, solvent system, and addition sequence.
- Material provenance: Raw-material lots, moisture condition, and storage history.
- Process trace: Temperature, mixing energy, residence time, and hold events.
- Rheology profile: At least three consistent measurement points covering the application's relevant flow range.
That dataset turns future failures into comparisons. Without it, each investigation starts from memory and guesses.
Closing the Loop on Viscosity with Data and AI
Viscosity is a diagnostic signal, not a complete control target. A sample can fall outside specification because of temperature, shear history, storage, moisture, dispersion, molecular-weight loss, or a changed raw-material lot. The same low reading can therefore point to several different causes. A release decision alone cannot separate them.
Inline rheometry narrows the blind spots between samples, but sensors do not explain material state by themselves. Torque, pressure, near-infrared signals, acoustic measurements, and temperature traces become useful when a model relates them to formulation and process conditions. Without that connection, the system can flag a deviation without showing whether the next action should address moisture, mixing, feedstock quality, or degradation.
Build the data foundation first
A closed-loop system starts with records that preserve cause and effect:
- Standardized batch records: Capture formulation versions, units, addition sequence, and operator changes.
- Raw-material fingerprints: Record supplier, lot, moisture, purity, and prior storage information.
- Time-resolved process traces: Store temperature, torque, pressure, shear, residence time, and sampling events.
- Multiple rheology points: Pair routine release measurements with flow-curve or oscillatory data when the application requires it.
- Causal context: Mark deviations, rework, equipment changes, and environmental conditions instead of treating them as noise.
The purpose is material-state awareness. A useful model distinguishes recipe drivers from process drivers, tests whether a correlation survives across batches, and recommends an experiment that can separate competing explanations. That changes viscosity control from chasing a setpoint to diagnosing why the setpoint was missed.
The University of Manchester work described earlier shows how this approach can support feedback control. Its nonlinear predictive framework used a deep neural network soft sensor for non-invasive feedback and maintained tight viscosity regulation under changing conditions, as reported in the nonlinear model predictive control study. The practical lesson is to interpret an inline signal through a model rather than treat it as an isolated number.
Start with one controllable bottleneck
Begin with one product line and one clearly defined viscosity KPI. Instrument the process step where material state changes most sharply, standardize the batch record, and compare model errors with laboratory results. A platform such as Polymerize can centralize experimental records and apply explainable materials models to properties such as viscosity across different shear conditions.
Use the first implementation to expose missing data before automating adjustments. Once the team can connect a viscosity failure to a likely causal driver, formulation experiments become more deliberate, scale-up decisions become easier to defend, and process control no longer depends on a static setpoint.
If your team still diagnoses viscosity problems through spreadsheets and isolated lab readings, visit Polymerize to connect formulation, process, raw-material, and rheology data in one materials R&D workflow. Use that foundation to identify causal drivers, plan targeted experiments, and build control around the actual state of the polymer system.
Put your R&D data to work
See how materials teams use Polymerize to plan fewer experiments and reach target properties faster.