

You know the day already. The DSC run looks a little off, the glass transition is subtle, and everyone in the room starts treating the curve like a verdict. Eight weeks later, the formulation has been rewritten, the pilot lot is delayed, and somebody finally asks whether the signal was real or just a baseline problem. That's the uncomfortable truth in polymer R&D, thermal analysis is trusted because it's useful, but it's often treated as if the instrument can think for us.
Table of Contents
- The Curve That Almost Killed a Formulation
- From calorimetry to today's instrument stack
- What the four observables tell you
- Blend miscibility and service temperature
- Filler loading and oxidation behavior
- Cure kinetics and mechanical confirmation
The Curve That Almost Killed a Formulation
The TPU blend had already gone through two rounds of compounding when the next DSC trace came back looking worse. The transition had shifted, the peak looked broader, and the team took it as proof that the new plasticizer package was destabilizing the blend. Procurement was ready to freeze the old recipe, because nobody wanted to explain a bad thermal result to management.
Then the lab repeated the run with tighter baseline control and a different pan setup. The change that looked like a formulation failure was mostly a measurement problem. That is the part people forget when thermal analysis becomes a routine checkbox, the curve can be real, but the interpretation can still be wrong.
I have seen the same pattern across DSC, TGA, and DMA. A curve that looks alarming often turns out to reflect sample mass, pan sealing, purge conditions, or thermal lag rather than chemistry. In polymer work, that distinction matters because a small processing change can move a glass transition, distort a melt peak, or change the onset of mass loss without telling you why unless the measurement system is controlled well enough to trust the result.
The field did not become practical overnight. Thermal analysis has deep roots, from Lavoisier and Laplace's ice calorimeter in 1782 to 1783, Franklin's 1780 work on thermal conduction, Fourier's 1807 thermal conductivity value, and Joule's experiments around 1860 that linked heat and electric current. It then matured into instrument-based science through Le Chatelier's work in 1887, Roberts-Austen's differential temperature measurements in 1899, and Honda's thermobalance concept in 1903. Commercial instruments arrived in the 1960s, and one industry history describes roughly 50 years of intense development after that as electronics, furnaces, and thermocouples improved measurement precision (history of thermal analysis, thermal-property metrology history).
That history is not trivia. It explains why the modern workflow is a connected system, not a set of isolated instruments. DSC contributes heat-flow, TGA contributes mass change, DMA contributes mechanical response, and the value comes when those raw outputs are tied to formulation records, processing history, and explainable models that suggest what to test next instead of leaving the analyst to guess from a stack of files.
Practical rule: treat every thermal curve as evidence, not as a conclusion. The curve starts the discussion, it does not end it.
What Thermal Analysis Actually Measures
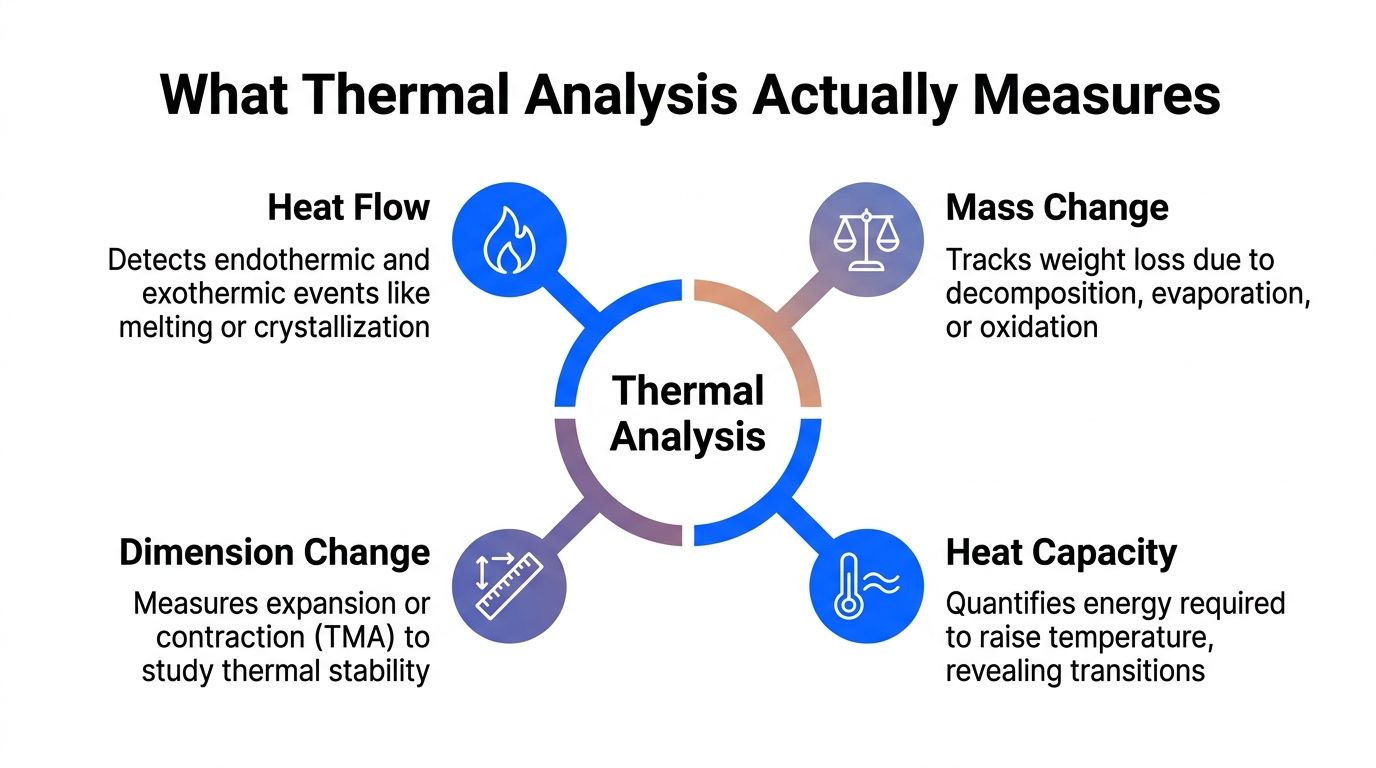
A formulation can look stable on paper and still fail in the lab because no one asked the right thermal question. Thermal analysis is a measurement family built around four physical observables, heat flow, mass change, dimension change, and heat capacity. If those are blurred together, the result is usually a neat-looking curve and a weak decision.
From calorimetry to today's instrument stack
The historical arc matters because it explains why the field looks the way it does. The ice calorimeter used by Lavoisier and Laplace in the winter of 1782 to 1783 was an early attempt to quantify heat directly, and later work by Franklin, Fourier, and Joule helped turn heat into something measurable, repeatable, and useful for engineering. The development of the thermocouple was the decisive step that made modern thermal analysis practical, because once temperature difference can be measured reliably, differential methods become usable across materials systems (thermal-property metrology history).
That is why a modern analyzer is really a controlled furnace, a precision sensor stack, and a data reduction system working together. DSC compares heat flow between sample and reference. TGA tracks mass as temperature changes. TMA watches dimension change under heat. DMA, while not thermal analysis in the narrowest sense, belongs in the same decision system because it maps mechanical response across temperature and frequency.
What the four observables tell you
Heat flow shows transitions such as melting, crystallization, and cure. Mass change shows volatilization, oxidation, and decomposition. Dimension change captures expansion and contraction, which matters when parts have to fit after heating. Heat capacity, often expressed through DSC signals near transitions, helps reveal thermal events that are easy to miss in a simple temperature sweep.
A procurement team may buy an “analyzer,” but the lab is really buying access to four different questions about the same material.
For polymer R&D, that distinction matters. If you ask the wrong observable to answer the wrong question, the instrument will still produce a curve, but the curve will not protect you from a bad formulation decision.
The Core Techniques Side by Side
The cleanest way to use thermal analysis is to stop treating DSC, TGA, DMA, and TMA like competing tools. They're a connected toolkit, and each one answers a different slice of the same materials problem. When they're used together, they reduce the chance that one curve gets promoted to the role of truth.
What each technique can and can't see
DSC is the workhorse for glass transition, melting, crystallization, and cure kinetics. It shows heat-flow events, which is why it's so useful for formulation work, but it won't tell you much about modulus or dimensional stability. A polymer can look thermally fine in DSC and still fail mechanically because its viscoelastic behavior never matched the use case.
TGA is the right tool for decomposition, oxidative stability, and filler or additive quantification. It sees mass, not heat flow. That makes it excellent for separating volatile loss from true breakdown, but it can't tell you whether a polymer softens early or whether a part creeps under load.
DMA captures viscoelastic behavior over temperature and frequency, which is exactly why modulus predictions from DSC alone often fall apart for elastomers and toughened systems. TMA measures dimensional change, so it's the most direct route to expansion and contraction questions.
Choosing the right method for the question
| Question to Answer | Best Technique | Typical Output | Key Limitation |
|---|---|---|---|
| Is there a glass transition, melting event, or cure exotherm? | DSC | Heat-flow curve | Sensitive to baseline quality and pan setup |
| Is the material losing mass from volatilization or decomposition? | TGA | Mass-loss curve | Won't show viscoelastic response |
| Will the polymer hold stiffness across temperature? | DMA | Modulus and damping response | Not a substitute for chemical stability |
| How much does the part expand or shrink? | TMA | Dimensional change curve | Doesn't explain chemistry by itself |
The best labs don't ask one technique to carry the whole interpretation. They sequence them. TGA can define the safe temperature window, DSC can map transitions inside that window, and DMA or TMA can show whether the thermal behavior matters in use.
Sample Preparation and Instrument Setup as a Craft
Most bad thermal data starts before the run starts. Pan selection, sealing quality, sample mass, purge gas, and heating rate all change what the curve can show, and in low-transition polymers those choices matter at the micro-watt level. For formulation work on polymers with weak thermal events, that's not a detail. It's the difference between seeing a transition and missing it entirely.
The numbers that actually matter
A recent procurement specification for low-transition polymers required baseline linearity < 5 µW, baseline repeatability < 10 µW, baseline noise < 0.2 µW, temperature accuracy ±0.025°C, and enthalpy precision ±0.04% over -50°C to 300°C (instrument specification). Those numbers matter because a weak glass transition, crystallization shoulder, or cure exotherm can disappear inside noise and drift long before anyone questions the formulation.
For TGA, the practical range is broader but no less demanding. Independent lab and procurement sources report systems operating to 1100°C to 1200°C, with sample masses from about 0.1 mg to 1000 mg, heating rates from 0.01°C/min to 500°C/min, and dynamic baseline drift as low as <10 µg at high temperature (thermal-analysis technique comparison). Atmosphere choice matters too, nitrogen or another inert gas for volatilization, air or oxygen when oxidation is part of the question.
A short setup checklist for new analysts
- Match pan and seal to the question: use a setup that controls evaporation when low-mass loss or cure chemistry matters.
- Keep sample mass consistent: don't let operator habit decide whether a weak event is visible.
- Name atmospheres clearly: nitrogen, air, or oxygen should never be implied from memory.
- Choose heating rate deliberately: fast scans are not a free speed boost if they blur overlapping events.
- Run baseline and reference checks often: drift becomes expensive when it's discovered after the formulation meeting.
- Document the exact file export: raw curve, metadata, and instrument settings should stay attached to the result.
If the analyst can't explain why that pan, that mass, and that atmosphere were chosen, the method isn't ready for decision-making.
A useful reference point for how method sections should read, especially when you're standardizing internal workflows, is Contesimal's research paper methods section. The structure there maps well to thermal analysis SOPs, because the reader needs setup logic before they can trust the result.
Reading Curves Without Fooling Yourself
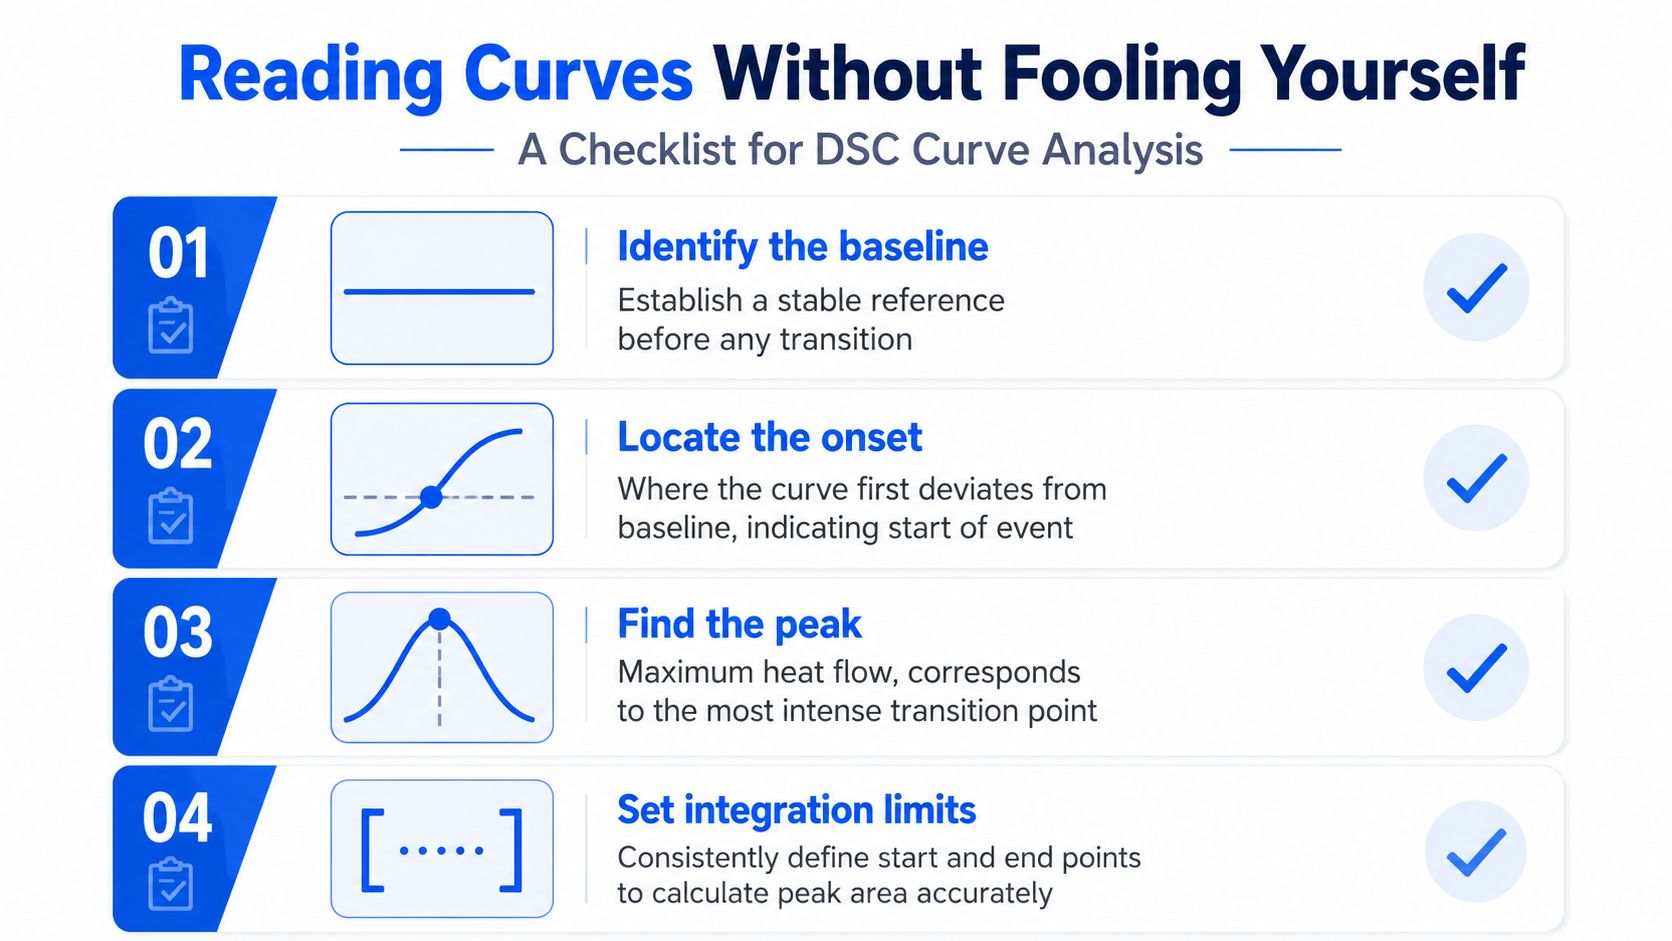
A DSC trace can look convincing long before it is trustworthy. Baseline choice, onset placement, peak selection, and integration limits all change the answer, and each one can be handled well or badly. In polymer work, the usual mistake is not missing a signal, it is reading too much into a signal that was never separated cleanly from the background.
What a real DSC curve needs
Start with a stable baseline. Then identify the onset, where the trace first leaves that baseline. Then identify the peak, the point of maximum intensity in the transition. Finish by setting consistent integration limits, because peak area only means something when the same rule is used every time.
That sounds simple, but weak events are where labs get into trouble. Moisture can look like degradation. Enthalpy relaxation can reshape a glass transition. Pan mass and seal quality can shift the apparent signal enough to change a lot-to-lot comparison. In TGA, condensation can make a mass-loss step look broader or less distinct than the chemistry really is.
Geometry and boundary conditions can dominate the answer
The sensor is not always the main source of error. NIST and USBR guidance on infrared inspection notes that the ideal instrument-to-target angle is 90°, and angles of incidence above 45° can introduce errors because reflections and target geometry change the apparent temperature (IR measurement guidance). The lesson carries over to thermal analysis. Boundary conditions and assumptions can outweigh the material response if the setup is careless.
A 2024 best-practices article in Electronics Cooling makes the same point in a modeling context, emphasizing that thermal-analysis accuracy depends heavily on boundary conditions, thermophysical properties, and modeling assumptions, and it recommends validation against test data. For polymer labs, that means a curve is never just the material. It is the material plus the pan, furnace, atmosphere, geometry, and reduction method.
A curve is defensible only when the analyst can explain what was controlled, what was assumed, and what could still be wrong.
That is the mental model worth keeping. Thermal analysis proves something specific, under specific conditions, for a specific sample. It does not remove the need to understand how the result was produced.
Three Polymer Workflows That Show Thermal Analysis in Action
The value of thermal analysis shows up when one instrument answers only part of the question and the rest of the workflow fills in the gap. The best polymer studies don't stop at a pretty curve, they use DSC, TGA, DMA, and sometimes TMA as a sequence of checks that shape the next formulation decision.
Blend miscibility and service temperature
In a TPU or TPU/PET blend, DSC is the first screen because it can show whether the thermal behavior looks like a mixed system or a set of separate phases. Multiple heating rates are useful here because they help reveal whether the apparent transition is stable or just a kinetic artifact. If the thermal event shifts in a way that doesn't match the formulation logic, the answer is usually not “the polymer is bad,” it's “the experiment needs tighter control.”
That's the practical part. A blend that looks acceptable in one thermal pass can still fail later if the result came from incomplete thermal history erasure or poor integration boundaries. DSC gives the R&D team a service-temperature clue, not a complete mechanical forecast.
Filler loading and oxidation behavior
For a silica-filled silicone, TGA in nitrogen and air are not interchangeable. Nitrogen helps separate volatilization from oxidation, while air exposes oxidative pathways that inert gas hides. That contrast is what lets the analyst distinguish moisture loss, plasticizer evaporation, oxidation, and real polymer decomposition.
The outcome matters for filler loading optimization because the residual mass and the sequence of mass-loss steps tell you what the compound really contains. A noisy baseline or too much sample can smear those steps together and make the composition look simpler than it is.
Cure kinetics and mechanical confirmation
Thermoset cure studies usually need more than one DSC mode. Isothermal DSC gives cure progress over time, while dynamic ramps help map the exotherm and thermal history. That information is useful, but it's still incomplete until DMA confirms whether the material reaches the expected glassy-to-rubbery transition.
That connection matters because cure completion on DSC doesn't guarantee the modulus profile you want in service. The thermal signature can look good while the viscoelastic response is still wrong for the part.
Thermal analysis works best as a chain of evidence. One curve sets the window, another identifies the transition, and a third confirms whether the formulation behaves the way the product needs.
From Scattered Curves to an AI-Ready Thermal Data Backbone
The bottleneck in modern thermal analysis is usually not the instrument. It's storage. One analyst saves DSC traces on a laptop, another emails TGA exports as PDFs, cure calculations live in personal spreadsheets, and DMA files sit somewhere no one links back to formulation records. That makes historical curves hard to compare and almost impossible to learn from at scale.
Why AI only works after the data is connected
Machine learning becomes useful only when it can join thermal curves with formulation, processing, and final-property data. Without that linkage, a model sees isolated traces instead of a materials system. That's why automated data handling matters before anyone starts talking about predictive intelligence, and Cyndra's automated data processing software guide is a useful reference for teams trying to reduce manual transfer work in adjacent lab workflows.
Polymerize's approach fits this problem from two angles. Polymerize Connect centralizes data from spreadsheets, ELNs, and instrument exports into a secure backbone. Polymerize Labs then layers explainable models that predict properties, optimize formulations, and surface causal drivers with confidence scores and historical precedents. In thermal analysis terms, that means the DSC or TGA curve stops being a one-off file and becomes part of a searchable decision record.
What changes when the curve becomes queryable
The practical shift is subtle at first. Analysts spend less time hunting for the right export and more time comparing runs that belong together. R&D leaders can ask which thermal signatures tend to show up before a formulation fails, which cure window gave the most stable downstream properties, or which analysts need method standardization.
The point isn't to replace thermal judgment with software. It's to make sure the judgment is built on data that can be traced, compared, and learned from. Once that exists, the next experiment stops being a guess and starts looking like a decision.
Your Next Quarter in Thermal Analysis
Start by standardizing sample mass, heating rates, atmosphere naming, file formats, and required metadata fields across DSC, TGA, DMA, and TMA. Then centralize raw curves and method records so the lab stops relying on individual laptops and emailed attachments. After that, automate comparison and outlier detection with explainable models so your team can spend less time recovering data and more time choosing the next experiment.
If your thermal curves are still scattered across folders, spreadsheets, and instrument exports, Polymerize can help turn them into a connected materials R&D record. The platform unifies experimental data with Polymerize Connect and layers explainable property models with Polymerize Labs, so teams can plan the next experiment from historical thermal behavior instead of guessing. Visit Polymerize to see how that workflow fits your lab.
Put your R&D data to work
See how materials teams use Polymerize to plan fewer experiments and reach target properties faster.