


A senior chemist opens the lab's master formulation workbook and finds three versions of the same polymer blend. One has a solvent ratio hidden inside merged cells. Another contains the latest test result, but only because a colleague has been copying values into a personal file for years. The third is the workbook everyone still calls the source of truth.
That situation is common in R&D. A spreadsheet can start as a useful experimental log, then become a formulation register, sample tracker, calculation engine, reporting layer, and unofficial archive. Eventually, nobody can explain which formulas are authoritative, who changed a value, or whether two apparently identical samples really use the same units.
Spreadsheet to database conversion solves only part of that problem if it stops at loading rows. The difficult work begins after import, when the team must preserve meaningful calculations, govern shared edits, support familiar analyst workflows, and expose clean records to ELNs and AI systems. The migration is therefore a shift from tribal knowledge to governed, queryable, AI-ready data.
Table of Contents
Why R&D Spreadsheets Stop Scaling
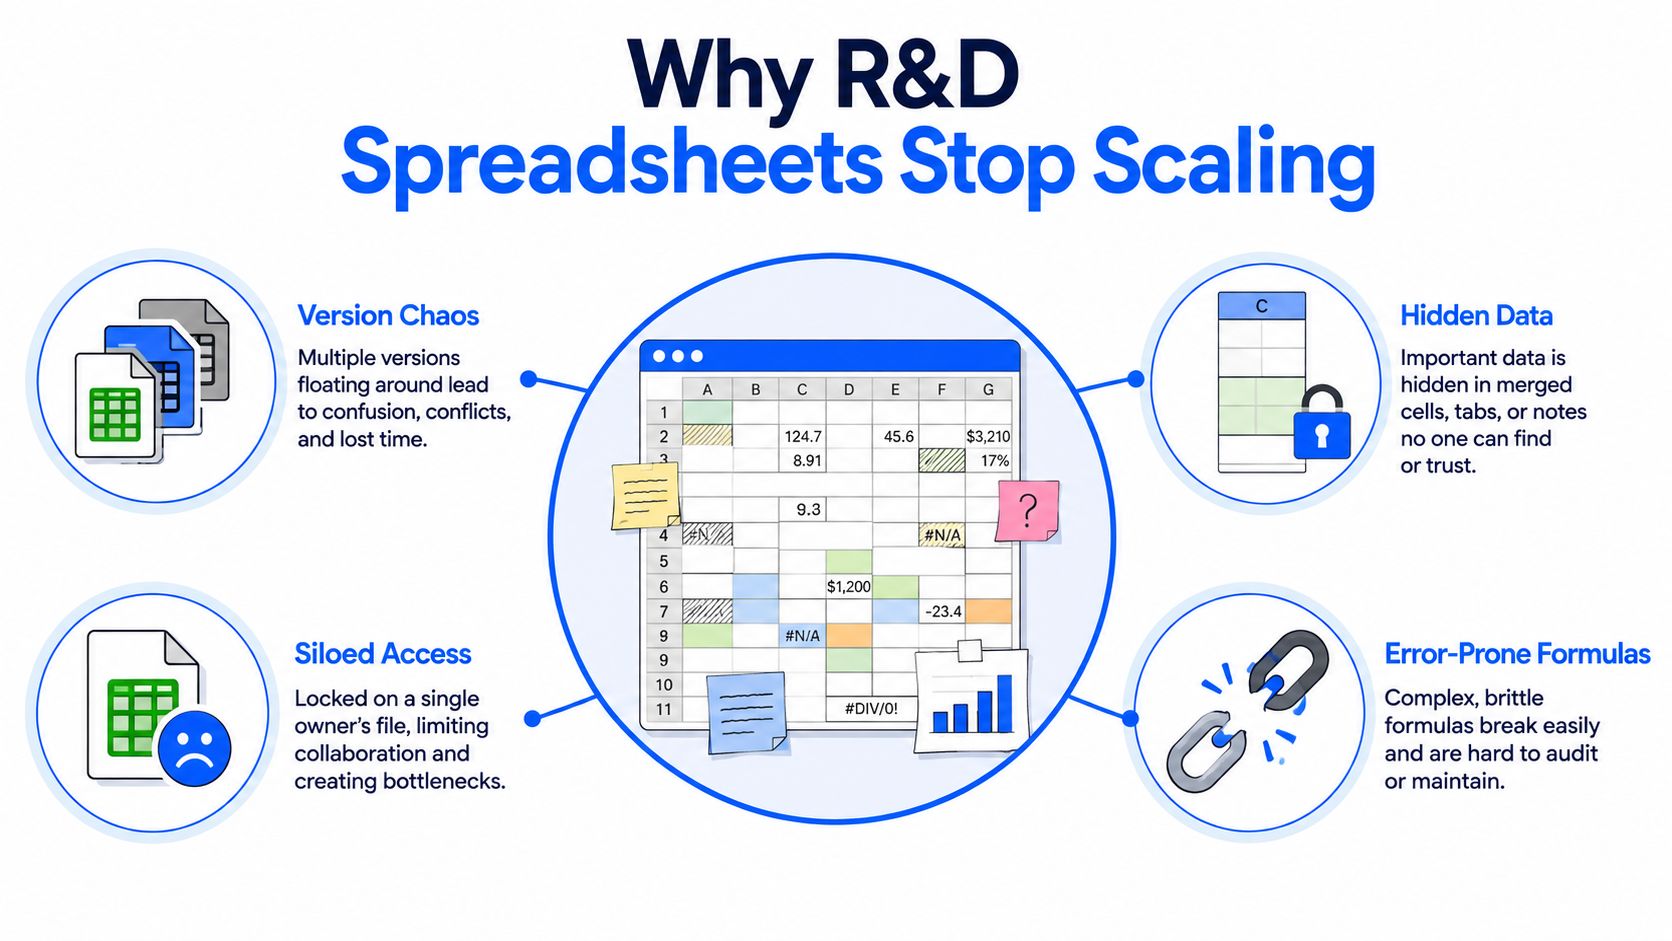
Spreadsheets fail in R&D because they combine flexible presentation with weak data governance. Merged cells make a worksheet readable to a person, but they hide the repeated relationships a database needs. A formula can look correct in one row and reference the wrong cells after sorting or inserting data. A batch identifier may carry critical context in free text, while a neighboring column uses a different naming convention for the same material.
The problem becomes measurable when spreadsheet logic grows. A widely cited review of 43 spreadsheet studies reported that 94% of spreadsheets contained errors, with an average cell error rate of 5.2%. Later work in the same research stream reported 1.79% general errors and 0.87% wrong-result errors in a study of 50 spreadsheets. These historical findings are documented in the spreadsheet error literature review from Dartmouth. The figures don't prove that every lab workbook is unreliable, but they establish why integrity, validation, and controlled transformation belong at the center of migration planning.
The failure modes that hurt laboratories most
- Concurrent edits: Shared workbooks can allow users to overwrite one another without a dependable record of the previous state.
- Formula drift: Sorting rows, inserting columns, or copying formulas can change references without making the resulting error obvious.
- Unit ambiguity: A value labeled “concentration” might represent mg, mg/mL, or weight percentage, depending on the author.
- Weak history: A spreadsheet can preserve file versions, but it rarely provides a reliable queryable history of every record and calculation.
- Manual transcription: Re-entering results between sheets creates another path for mismatch. Research on electronic transcription reported error rates from 1% to 124 per 10,000 fields, while one double-entry comparison found 6.5% of entered fields mismatched. The same source reported that professional data managers using consistency checks reduced errors to 13 and 15 per 10,000 fields. See the electronic transcription error study for the underlying findings.
A relational database brings typed fields, referential relationships, transactions, and auditability. It won't automatically preserve a chemist's familiar worksheet layout, and it won't clean ambiguous data by itself. Those trade-offs are why a successful conversion includes schema design, staging, validation, access policy, and a deliberate post-import operating model.
Planning the Conversion and Designing the Schema
Start with an inventory, not an import script. List every workbook used in active experiments, reporting, formulation management, sample tracking, and instrument review. Mark each file as a source of truth, a derived report, an abandoned file still referenced by someone, or an unknown case that needs owner confirmation.
Map the entities before creating tables
A workbook often contains several entities in one visual grid. A polymer screening sheet might include experiment metadata at the top, formulation components in repeated rows, sample identifiers in a side block, and measurement results across columns. Treating the entire sheet as one database table preserves the layout but creates duplication, update anomalies, and unclear relationships.
A more durable model could contain:
- Experiment: experiment ID, project, owner, start timestamp, and protocol reference.
- Sample: sample ID, experiment ID, formulation or batch reference, preparation details, and lineage.
- Measurement: measurement ID, sample ID, test method ID, observed value, unit, instrument, and timestamp.
- TestMethod: controlled method ID, method name, version, and reporting unit.
The relationships matter. One experiment can produce multiple samples. One sample can have multiple measurements. A test method can apply to many measurements, but the method version used for each result must remain identifiable.
Practical rule: Design around the questions researchers need to ask, not around the visual shape of the workbook.
Normalize deliberately, then make selective exceptions
Move repeated values into reference tables and connect records with stable primary keys and foreign keys. Use names such as experiment_id, sample_id, and measurement_id consistently, and avoid making a human-readable batch label the only key. A generated identifier can remain stable even when the displayed name changes.
Normalization shouldn't become a rigid doctrine. A curated reporting view can repeat project names or common formulation attributes when that makes analyst queries easier or improves read performance. Keep the normalized tables authoritative, then expose denormalized views for dashboards and familiar exports.
Composite samples need explicit treatment. If one sample spans multiple rows because it contains several components, create a parent sample record and a child component table. Don't rely on row order or merged labels to reconstruct that relationship later.
Cleaning and Normalising Lab Data Before the Move
Importing dirty data into a clean schema only relocates the mess. Clean the source before promotion, but preserve the original row exactly so that every transformation remains explainable.
Begin with structural repairs. Unmerge cells, fill down values that were visually inherited from a grouped heading, separate notes from measurements, and turn repeated blocks into rows. A merged “Solvent ratio” label should become a value on each applicable formulation or component record, not a formatting dependency.
Units need their own rules. Store the numeric quantity separately from the unit, and convert only when the source unit is known. “12” under a column labeled T (C) is not interchangeable with “12” under a temperature field that might contain Kelvin. If the workbook is ambiguous, preserve the raw value and route it for owner review instead of guessing.
Identifiers and people require canonical records. The value PVA-178 / 99% should become a polymer foreign key pointing to PVA-178, with 99 stored in a controlled purity_percent field. John (temp) should resolve to an operator record with a defined status or role, rather than remaining a free-text person label. A date such as 12/3/24 must be parsed with an explicitly chosen format and recorded with its source timezone context when available.
| Dirty Value in Sheet | Clean Value in Database | Rule Applied |
|---|---|---|
PVA-178 / 99% | polymer_id = PVA-178, purity_percent = 99 | Split identifier from purity and validate the polymer against a reference table |
John (temp) | Canonical operator_id, with role or status stored separately | Match aliases to an operator master record |
12/3/24 | Parsed date using an explicit format | Require the source owner to confirm day-month or month-day meaning |
25 mg/mL | quantity = 25, unit = mg/mL | Separate numeric value and unit, then apply approved conversion rules |
B-104 | B-104 | Trim leading and trailing whitespace from batch identifiers |
#18.4 | 18.4 with a raw-value flag | Remove display prefixes only when the field definition confirms the value is numeric |
Use a staging layer
A staging table should mirror the raw sheet closely, including source filename, worksheet name, row reference, import timestamp, and the original text values. Downstream transformations can then produce clean tables or views without destroying the evidence needed to investigate a disputed result.
This pattern also supports repeatability. If a rule changes, rerun the transformation against the preserved source rather than editing the production record by hand. R&D data changes through correction, reinterpretation, and new instrument exports, so a one-time cleanup script won't be enough.
Migration Tools and Scripts That Actually Fit R&D
No single migration tool handles every laboratory workbook well. The right choice depends on whether the import is a one-off event, whether transformations are simple or domain-specific, and whether spreadsheets will remain an ongoing source.
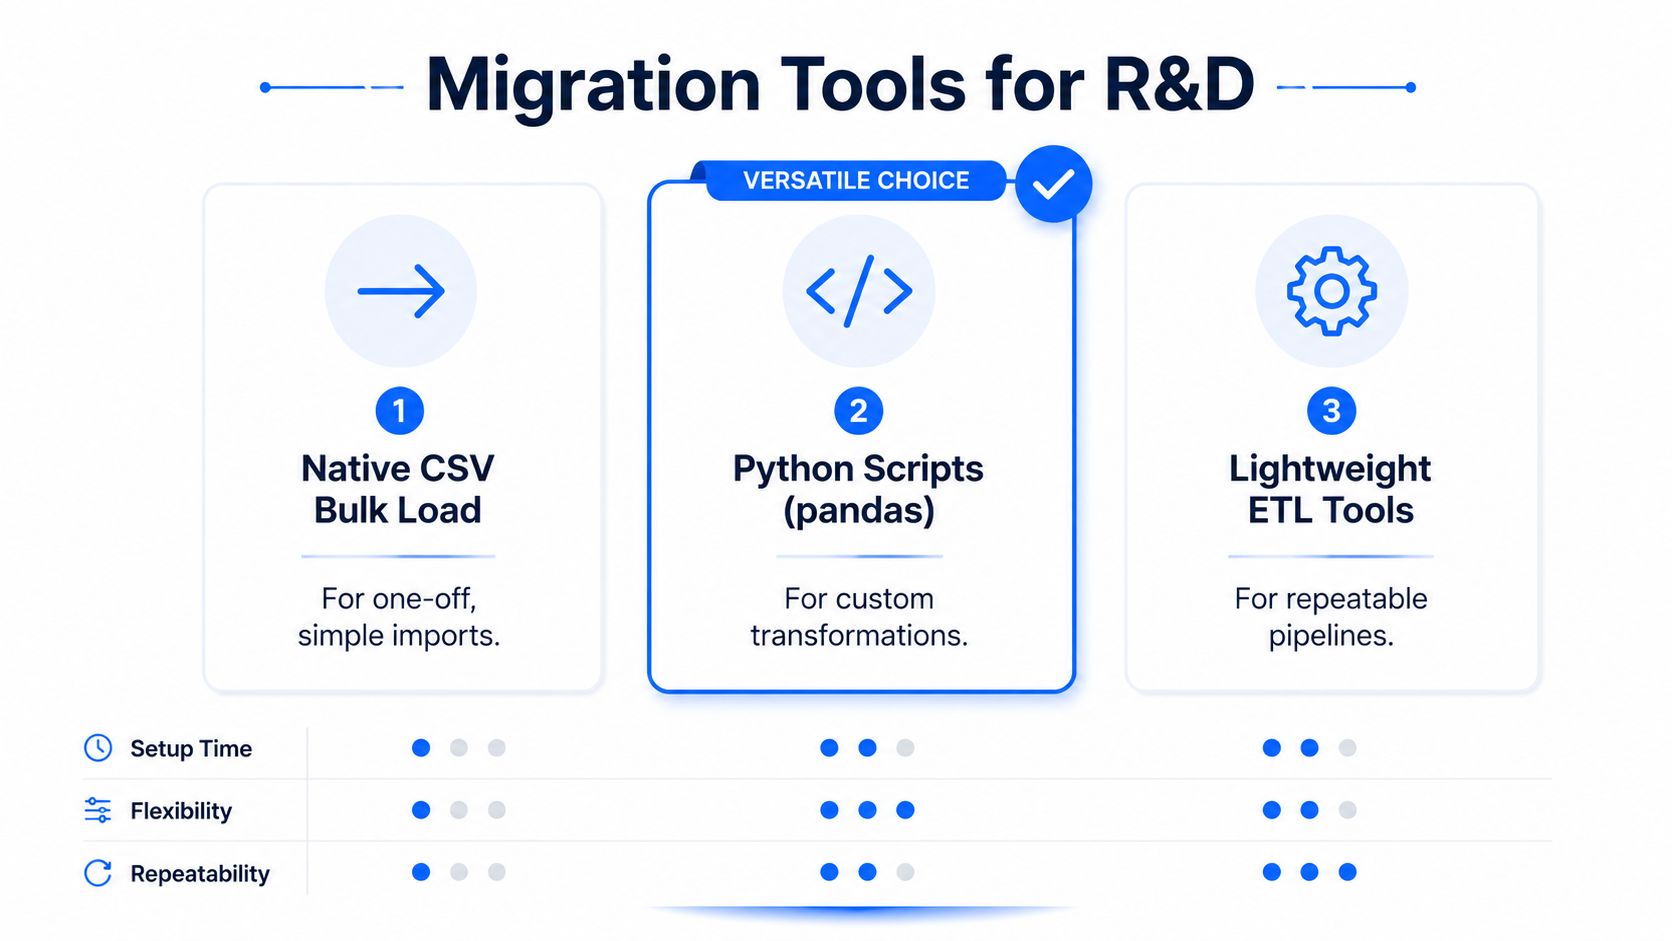
| Approach | Works well for | Where it breaks |
|---|---|---|
| Native CSV bulk load | A clean, one-off export with stable columns and limited transformation | Encoding problems, embedded delimiters, inconsistent line endings, and ambiguous nulls |
| Python with pandas and SQLAlchemy | Bespoke parsing, unit handling, workbook-specific logic, and repeatable tests | Memory pressure on wide sheets, fragile scripts without fixtures, and hidden behavior around missing values |
| Lightweight ETL tools | Recurring ingestion from files or connected sources | Schema drift, connector assumptions, and transformations that need detailed R&D context |
CSV bulk loading is fast when the source is already tabular. It isn't a semantic migration tool. A cell containing a formula may arrive as a displayed value, a blank may be treated differently from a null, and character encoding can damage instrument or operator names.
Python is usually the most flexible choice for irregular lab data. Use it to read workbooks, apply explicit parsing functions, validate expected columns, and write to staging. Don't let pandas decide what a missing value, timestamp, or mixed-type column means. Add tests for representative workbooks, including known edge cases.
ETL platforms such as Airbyte, dlt, and Fivetran can help when sheets or file repositories remain part of the operating process. They don't remove the need for schema contracts. If a scientist renames Sample ID to Sample Identifier, the pipeline should fail visibly or route the file for review, not create a partially populated table.
Make staging the common architecture
The most practical pattern is hybrid:
- Load the raw workbook or CSV into a staging table.
- Apply cleaning and normalization with SQL views, dbt models, or tested Python transformations.
- Promote valid records into relational tables.
- Store rejected rows and validation messages for owner review.
- Record source metadata so every production value can be traced back.
Watch for silent failures, especially truncated VARCHAR values, dropped NaN values, and timestamps coerced to UTC without preserving timezone metadata. A migration is trustworthy only when the team can rerun it and explain what changed.
Validation and Testing After the Import
A successful database connection proves almost nothing about data correctness. Validation must compare the source workbook, staging records, and promoted tables through repeatable gates.
Start with reconciliation. Capture the source row count for each logical dataset, then compare it with staging and production counts. Counts alone won't detect duplicated or transformed values, so calculate checksums or aggregate signatures for important numeric fields. For example, compare the spreadsheet's SUBTOTAL output with database results such as:
SELECT COUNT(*) AS row_count, MIN(value) AS minimum_value, MAX(value) AS maximum_value, AVG(value) AS average_value FROM measurement_staging WHERE source_sheet = 'Results';
The query isn't a substitute for domain review. It is a fast way to flag a mismatch before researchers discover it in a report.
Build assertions around relationships and meaning
Foreign-key checks should confirm that every measurement points to an existing sample, every sample points to an experiment, and every measurement method exists in the approved test-method table. A relationship query can isolate failures:
SELECT m.measurement_id FROM measurement m LEFT JOIN sample s ON m.sample_id = s.sample_id WHERE s.sample_id IS NULL;
Unit checks need the same discipline. A column labeled T (C) should be tested against a documented Celsius range assertion, with exceptions routed to review. Do not convert values when the source unit is unknown.
| Check Type | Example Query / Rule | Pass Criteria |
|---|---|---|
| Row reconciliation | Compare source, staging, and production counts by worksheet and logical dataset | Counts match, or every difference has a recorded reason |
| Numeric aggregates | Compare count, minimum, maximum, and average with source summaries | Values match within an approved rounding rule |
| Foreign keys | Find measurements without samples and samples without experiments | No orphaned records |
| Null rates | Compare missing-value counts for each required field | Differences are explained and accepted |
| Unit assertion | Validate T (C) against the approved Celsius rule | Values pass or appear in an exception queue |
| Duplicate detection | Group by stable business identifiers and source references | Duplicates are resolved or explicitly marked |
Validation should run after every import, not just during cutover. Send a diff report to the data owner so column drift, new nulls, and unexpected identifiers become visible while the source is still available. Teams building a broader modernization roadmap may also find Software Modernization Intelligence on data useful for framing governance and quality work beyond the immediate migration.
Security, Access Controls, and Audit Trails
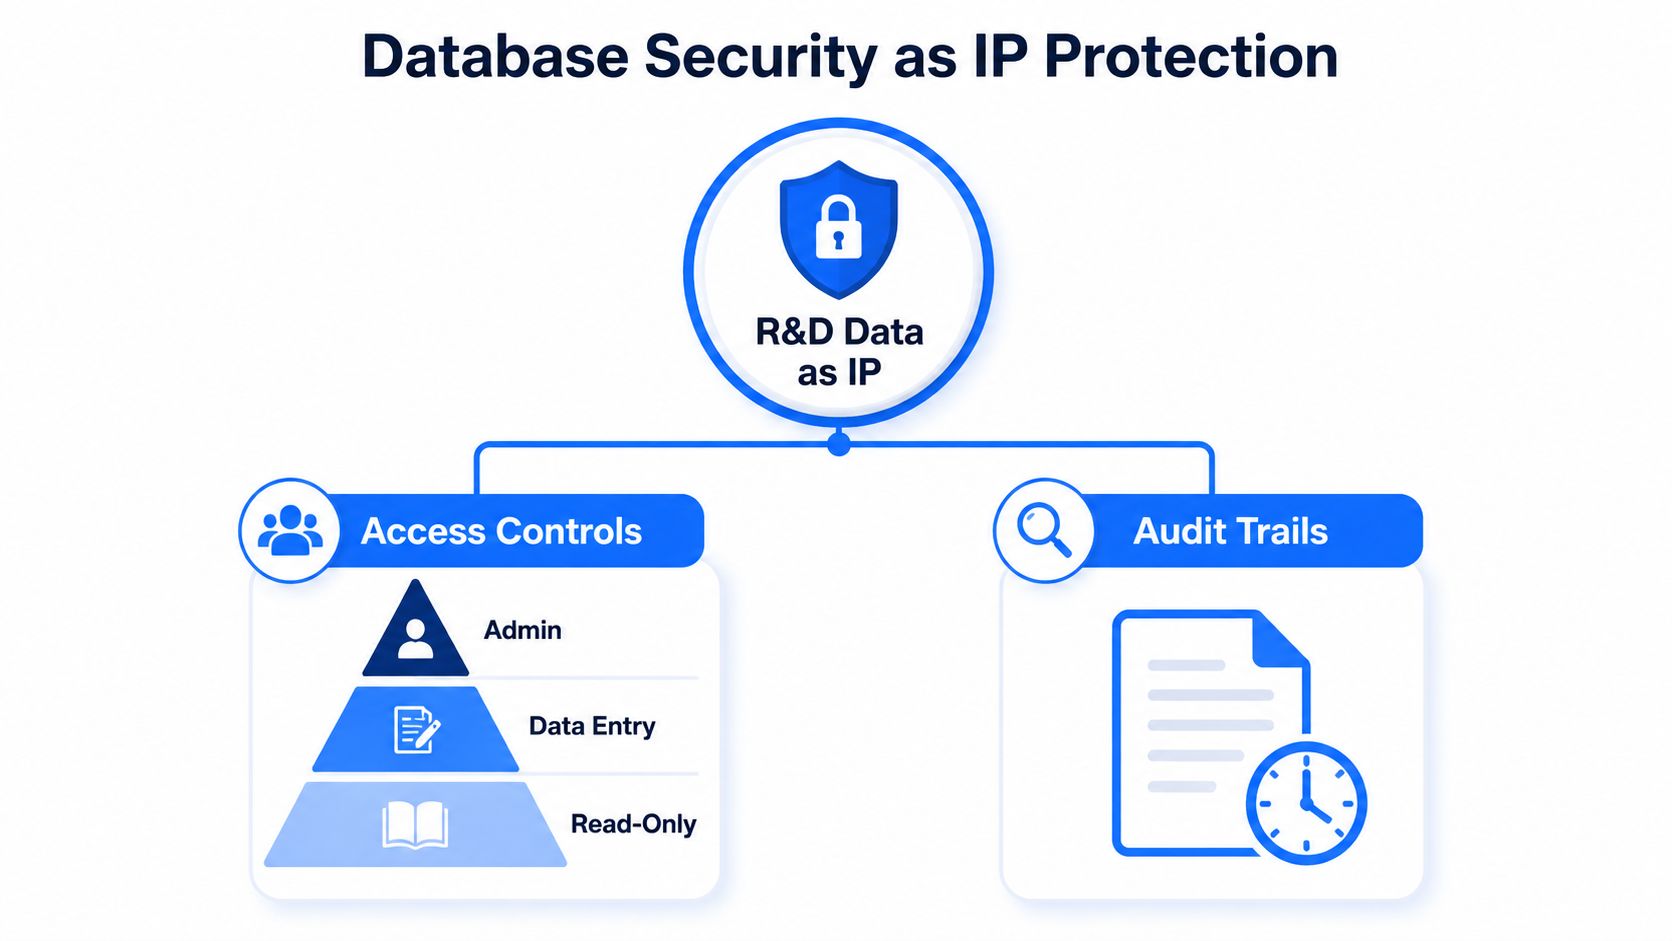
Formulations, synthesis routes, characterization results, and failed experiments are intellectual property. A database that treats every user like a shared-drive editor creates the same governance problem in a more permanent system.
Use role-based access from the first production release. Cross-functional analysts may need read-only access to approved views, while experiment owners need write access to records they manage. Administrative privileges should remain with the data engineering or platform team, not with every scientist who needs to correct a sample label.
Match permissions to sensitivity
Row-level security is useful when several projects share infrastructure but have different confidentiality requirements. A researcher might query common test methods and public reference materials while seeing only records tied to their project or approved collaboration group.
Column-level masking can protect researcher contact details or other personally identifiable information without hiding the scientific fields analysts need. Access should be granted to roles, not managed through ad hoc file-sharing decisions.
Make every change explainable
An audit trail should capture who changed a record, what changed, and when. Use append-only change records with old and new values, operation type, actor identity, and a transaction timestamp generated by the database. Application timestamps alone are weaker because they can be missing, altered, or inconsistent across clients.
Retention rules should cover raw imports, rejected rows, promoted records, and audit events. Export controls matter just as much. Notebook integrations, APIs, and downloaded CSV files create exit points where sensitive data can leave the governed environment, so authenticate those paths, log exports, and limit fields to what the consumer requires.
Connecting the Database to ELNs and AI Pipelines
A migrated database earns its place when researchers can use it without rebuilding their work in a second system. The ELN connection should reduce duplicate entry, not force scientists to abandon useful notebook habits.
On the ELN side, expose structured experiment and sample data through stable APIs or governed views. During notebook entry, a scientist should be able to look up a sample and retrieve its lineage, formulation context, and prior measurements. When an experiment is committed in the ELN, the integration should send the approved record back to the central database with an idempotency key, so retries don't create duplicate experiments.
The database should remain clear about which system owns each field. An ELN may own narrative observations and protocol execution, while the relational store owns canonical sample IDs, controlled methods, measured values, and lineage relationships. Without field-level ownership, reverse synchronization becomes a conflict-resolution project disguised as an integration.
Give AI systems dependable inputs
AI and machine learning pipelines need more than a large collection of rows. They need stable IDs, explicit units, ISO-formatted timestamps, versioned datasets, and audit columns that show when a record was created, corrected, or superseded.
Expose curated tables rather than raw staging data to feature stores and model-training jobs. Register dataset versions with experiment tracking tools such as MLflow, retain the transformation version used to produce each feature, and prevent future corrections from changing a historical training set.
The feedback path matters too. If a model flags a suspect batch, the result should connect to the relevant sample, experiment, and test method. A prediction endpoint that returns an untraceable warning won't fit a laboratory workflow. Store the model version, input dataset version, prediction timestamp, and review outcome so scientists can distinguish an automated signal from a confirmed laboratory finding.
AI-ready doesn't mean AI-generated. It means the data has stable identity, defined meaning, traceable history, and controlled access.
Use a staged rollout
A practical first 90-day rollout can follow this sequence:
- Days 1 to 30, establish connectivity: Select one representative project, connect the database to the ELN test environment, verify authentication, and test sample lineage lookups and write-back behavior.
- Days 31 to 60, run with pilot users: Include scientists, analysts, and data owners. Compare database outputs with the existing workbook, capture workflow friction, and train users on corrections, exceptions, and approved exports.
- Days 61 to 90, enforce system-of-record behavior: Freeze new edits to the pilot workbook, route corrections through governed interfaces, and review reconciliation reports, orphan counts, failed imports, and active usage with the project owner.
The handoff is complete when the old spreadsheet no longer receives authoritative edits. Keep it available as an archived reference, but make the database the place where new samples, measurements, lineage updates, and approved corrections live.
If your materials team needs to replace fragile workbooks with a secure, connected data backbone, explore Polymerize. Polymerize can unify experimental data from spreadsheets and other R&D sources, helping teams create structured records that are ready for governed analysis and AI workflows.
Put your R&D data to work
See how materials teams use Polymerize to plan fewer experiments and reach target properties faster.