

You're on a pilot line, the lab data looked clean, and the first production lots still drift out of spec. The temptation is to add one more final inspection step and hope the bad parts get caught before shipment. That usually misses the core problem, because quality control in manufacturing starts with the process, not the warehouse dock.
The stronger model is simpler to think about and harder to execute. You define what matters, measure it early, watch variation before it becomes scrap, and feed what you learn back into R&D, scale-up, and production control. That's how modern teams move from “detect defects” to control the conditions that create defects.
Table of Contents
- Phase one starts with data you can trust
- Phase two is baseline control
- Phase three narrows risk with characteristic classification
- Phase four pilots AI in a controlled slice
What Quality Control in Manufacturing Really Means
You can have a formulation that looks perfect in the lab, then watch it behave differently on the pilot line. In polymers, that often happens when a resin blend passes bench-scale checks but turns sensitive to temperature, shear, or raw-material variability once the process runs continuously. The mistake isn't usually “bad testing.” It's treating quality as a gate at the end instead of a property of the whole system.
Quality control is the part of the system that checks whether the process and product are staying within defined limits. Quality assurance is broader, it focuses on the methods, standards, and controls that make good output more likely in the first place. Inspection is the act of checking a material, component, or finished part. Those terms overlap in real plants, but they answer different questions, and a new R&D lead needs that distinction to avoid mixing process design with release activity.
Think in terms of a loop, not a checkpoint
Modern statistical quality control emerged when Walter A. Shewhart developed the control chart in 1924 and later published his 1931 work on economic control of quality. That framework established the core idea of separating common-cause from special-cause variation using process data, not just end-of-line inspection, and it still underpins SPC with control limits typically set at ±3σ (Symestic's historical overview of statistical quality control).
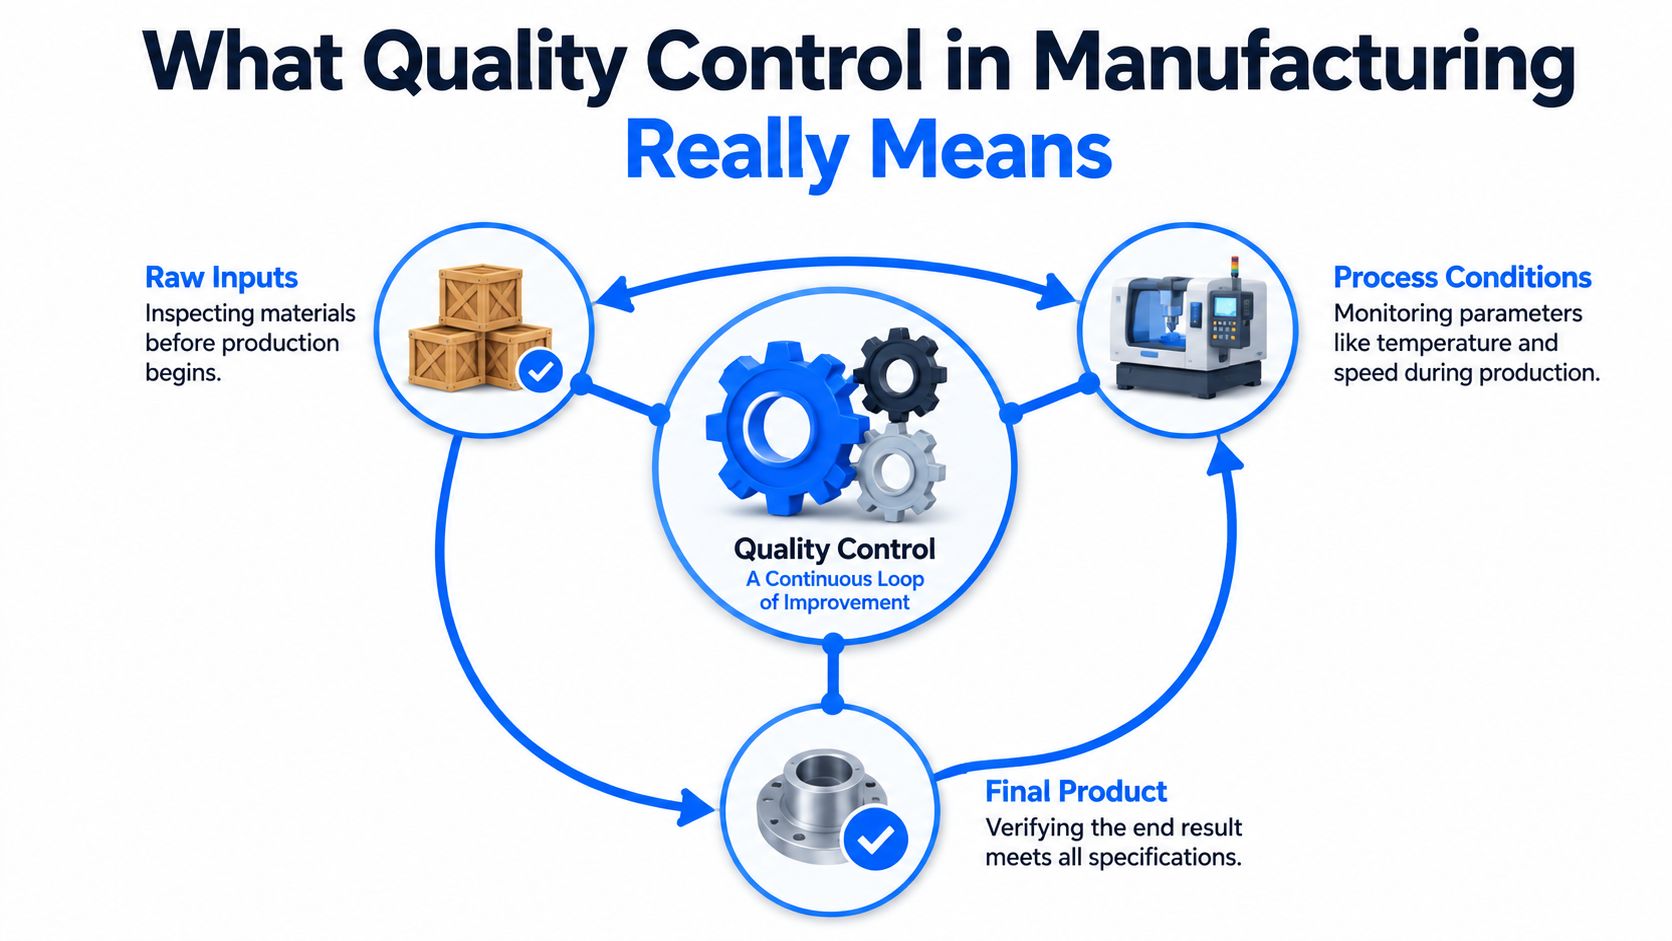
That loop matters because the same resin drum, the same extruder, and the same operator can produce different outcomes if the process conditions drift. A sensible QC system therefore watches raw inputs, process conditions, and final product together, with different checks at each point. If you only inspect at shipment, you can still ship a lot of avoidable rework.
Practical rule: if a defect can be predicted from process data, you should try to catch it before the defect physically exists.
In practice, this is why a useful QC setup often includes incoming checks, in-process monitoring, and final verification. A QA lab furniture resource such as Labs USA pharma furniture is relevant here because the physical layout of a QA or QC lab affects how quickly samples move, how consistently they're handled, and how well teams separate testing from production noise.
The mental model to keep is simple. Quality is not just a shipment decision. Quality is a process capability decision. If the process is stable, the product is more likely to be stable. If the process is drifting, final inspection is only documenting the drift after the fact.
Core QC Methodologies Every Manufacturer Should Know
A lot of QC confusion comes from using one tool for every problem. A line operator, a lab chemist, and a quality manager may all say “we do QC,” but they may be talking about completely different actions. The useful way to organize the field is by the question each method answers.
Start with stability, then move to risk
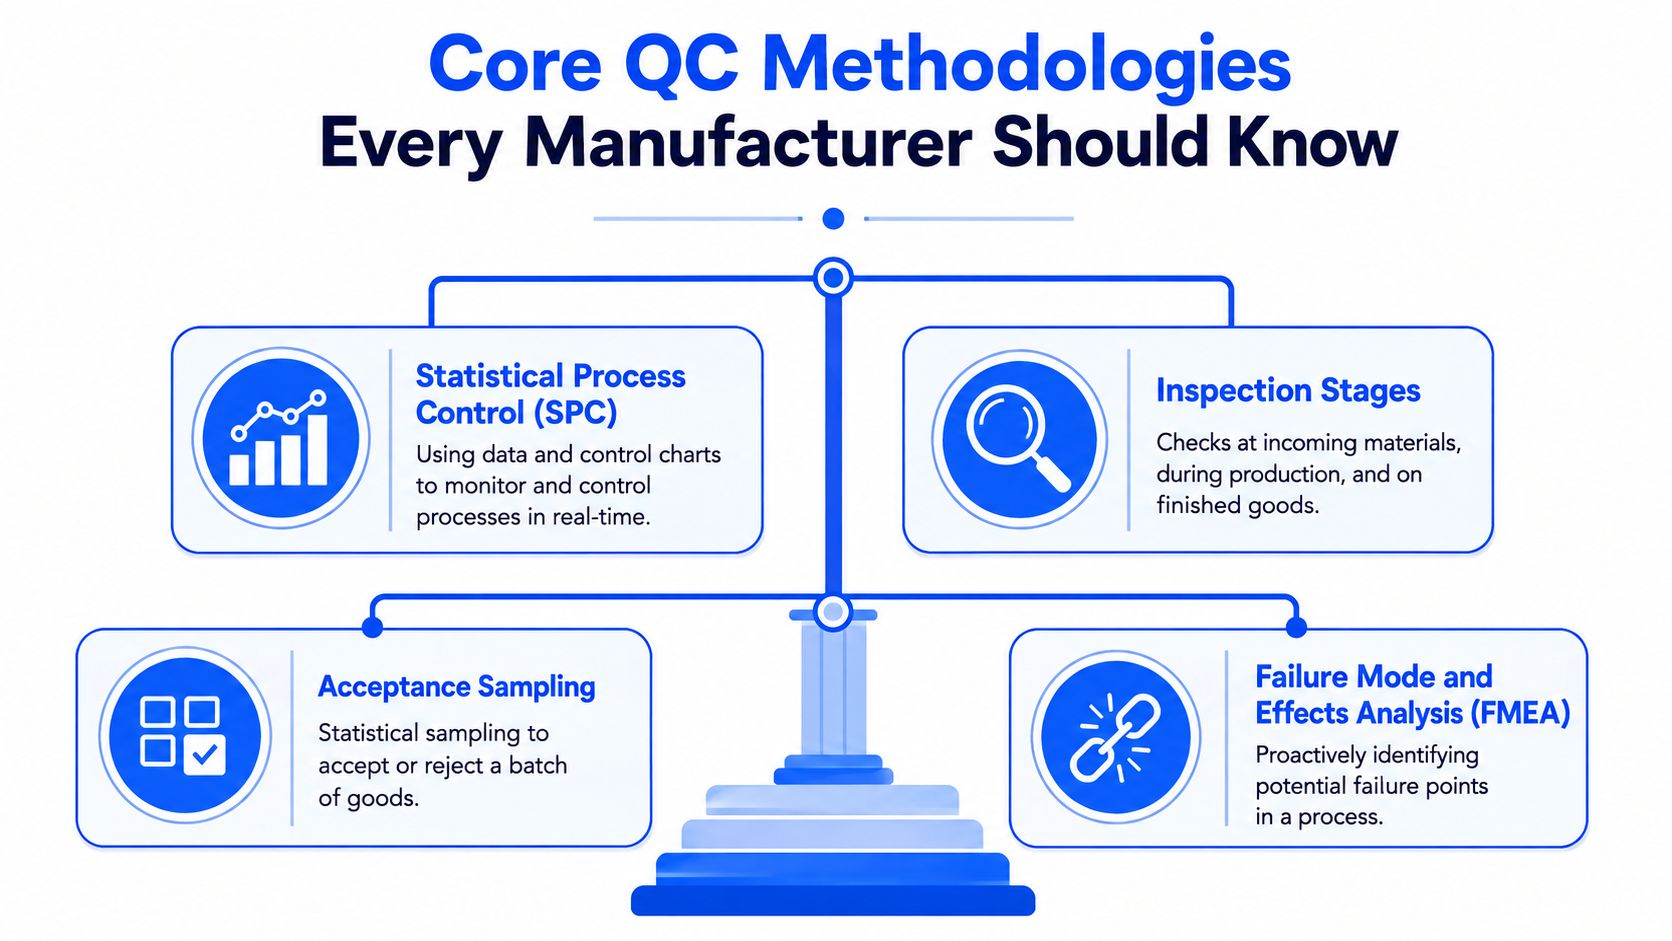
SPC asks whether the process is stable over time. It uses data and control charts to spot drift before a batch fails, which is why it's the right tool for dimensional measurements, viscosity trends, temperature, pressure, and other critical-to-quality variables. In a polymer extrusion line, for example, SPC can flag a slow shift in melt temperature long before the film thickness moves out of spec. That's earlier, cheaper, and less disruptive than waiting for a reject bin to fill up.
Inspection answers a different question, whether a material or product meets a defined requirement at a specific point in time. Quality programs often place inspection at incoming, in-process, and final stages, because catching deviations closer to the source reduces propagation downstream (Usersolutions' manufacturing QC guide). That structure is useful, but it's not enough by itself for processes that drift gradually.
Good inspection finds bad parts. Good SPC helps you stop making them.
Use the right tool for the decision
Acceptance sampling is for lot decisions when 100% inspection isn't practical or necessary. You inspect a sample, then decide whether to accept or reject the batch. That's common when the question is about supplier lots, not continuous process control.
FMEA asks what could fail, how badly, and where the process is vulnerable. It belongs early, especially in a pilot line, because it helps teams rank failure modes before they become recurring plant problems. If your concern is preventing unplanned downtime, a useful practical overview is Forge Reliability's guide to prevent unplanned downtime with FMEA, which fits naturally with a risk-based QC strategy.
Six Sigma gives a process capability target, not a feeling. The widely cited benchmark is 3.4 defects per million opportunities, which is useful because it turns “better quality” into a concrete goal (manufacturing quality statistics and benchmarks).
| Metric or method | What it measures | Best used for | Watch out for |
|---|---|---|---|
| SPC | Process stability over time | Continuous variables on the line | Misreading random noise as a real shift |
| Inspection | Conformance at a point in time | Incoming, in-process, final checks | Catching defects after they've already been made |
| Acceptance sampling | Lot accept or reject decisions | Supplier lots and finite batches | Overtrusting a small sample for unstable processes |
| FMEA | Failure modes and risk ranking | New processes, pilots, scale-up | Treating the worksheet as a substitute for process data |
| Six Sigma | Defect reduction and capability goal | Mature processes with stable data | Chasing the label instead of fixing variation |
When you match the method to the decision, QC gets much clearer. SPC and FMEA are especially strong together, because one watches live behavior while the other names the failure paths that deserve attention.
The QC Metrics That Actually Drive Decisions
Teams often drown in dashboards because they track too many outputs and too few decision metrics. The useful numbers are the ones that tell you whether the process is capable, whether the yield is healthy, and whether a problem is getting expensive.
Read capability before you read blame
Cp and Cpk are process capability indices. Cp tells you how wide the process spread is relative to the specification width, while Cpk also accounts for how centered that process is. That means a process can look acceptable on spread and still be badly off-center, which is why a high Cpk matters more than a high Cp when you're deciding whether a process is under control.
For a new R&D lead, the practical reading is this. If Cp is decent but Cpk is weak, the process probably needs centering, not just tightening. If both are weak, the process is too variable for confident release decisions.
Use yield metrics for operations, capability for improvement
First-pass yield (FPY) tells you how much product clears the process without rework. Rolled yield shows how yield accumulates across multiple steps, which makes it more revealing in multi-stage manufacturing. Defect rate per million opportunities is useful when you need a normalized way to compare performance across products or lines, especially when opportunities for failure aren't identical.
The mistake is using one metric for every conversation. A daily production meeting should care about FPY, rejects, and obvious drift. A quarterly capability review should care about Cp, Cpk, and the relation between the process window and the spec window.
| QC metric at a glance | What it measures | Best used for | Watch out for |
|---|---|---|---|
| Cp | Spread versus tolerance | Capability when centering is already good | Ignoring whether the process is on target |
| Cpk | Spread and centering versus tolerance | Release readiness and stable process review | Treating a single good value as permanent |
| FPY | Output that passes without rework | Daily production health | Hiding scrap that gets reworked later |
| Rolled yield | Yield across a sequence of steps | Multi-stage lines and batch routing | Losing visibility into where the loss happens |
| Defect rate per million opportunities | Normalized defect burden | Cross-line and cross-product comparison | Overstating precision if the underlying data are weak |
A useful rule in polymer plants is to tie the metric to the decision owner. Operators need near-real-time process signals, engineers need capability trends, and managers need cost and throughput implications. If everyone looks at the same chart for every purpose, nobody gets a clear answer.
Connecting QC with R&D and Scale-Up
The biggest quality mistake in advanced materials is pretending the lab and the plant are separate worlds. They aren't. They're the same system at different volumes, with different sources of noise, and QC has to be designed across both.
Build the control logic before the first commercial run
During formulation work, design of experiments helps you map which inputs move the output. In a polymer lab, that might mean comparing resin ratios, catalyst loadings, mixing speed, or cure profile so you can identify which variables deserve tight control later. The result isn't just a better recipe. It's a list of critical-to-quality variables that should be carried into pilot and scale-up.
That list should feed into an FMEA before the process is frozen for production. If a specific feedstock impurity or temperature swing can break the product, the incoming inspection plan and the in-process SPC plan should both reflect that risk. This moment marks the transition where the control plan stops being paperwork and starts becoming engineering.
Translate lab knowledge into plant limits
Pilot runs are the bridge. They show which lab correlations survive contact with plant reality and which ones only looked good at benchtop scale. Once those critical windows are known, the team can set control limits from actual process behavior, then refine them as more production data arrive.
Practical rule: if a lab variable matters to product performance, it should either appear in the plant control plan or be explicitly ruled out with data.
Supplier variability deserves the same treatment. If a raw material lot changes behavior, incoming inspection shouldn't be a generic receive-and-release exercise. It should be tied to supplier capability, known critical characteristics, and the product risk attached to that material. That's more efficient than blanket checks, and it's safer than assuming every input is equivalent.
This is also where a platform like Polymerize can fit naturally. It unifies experimental and process data into a single system of record, which helps teams connect formulation data, pilot results, and production QC without losing traceability. The value isn't the label on the tool, it's the ability to carry learning from R&D into scale-up without rebuilding the logic by hand.
The bridge is statistical discipline. If the lab says a window matters, the plant has to measure that window. If the plant sees drift, R&D has to know whether the problem is formulation, raw input, or process conditions.
AI-Enabled QC Workflows That Change the Game
AI only becomes useful in QC when the classical foundation is already in place. If the data are messy, the labels are weak, or the process is unstable, machine learning just helps you automate confusion faster. When the foundations are good, though, AI can move QC from detection toward prediction.
Three workflows that actually change decisions
The first is predictive quality. A model uses historical SPC, batch records, and release outcomes to estimate whether a batch is likely to pass. That lets teams focus attention earlier, especially on borderline lots. The model doesn't replace release testing, but it can tell you where to look first.
The second is anomaly detection on streaming process data. Instead of waiting for control limits to be crossed, the system watches for unusual patterns in temperature, pressure, vibration, composition, or machine signals. The point is not to drown people in alerts. The point is to surface drift early enough that an engineer can intervene before scrap builds.
The third is root-cause analysis. Here AI links defects back to likely causes by correlating process conditions, formulation inputs, and inspection results. That's especially useful when a failure is intermittent and the human eye keeps chasing the wrong variable.
The recent research direction is clear. A 2025 systematic review says Industry 4.0 and the move toward Industry 5.0 are reshaping quality management, while also emphasizing implementation challenges rather than easy gains (systematic review on Industry 4.0, Industry 5.0, and quality management). A 2024 review of robotic QC applications points in the same direction, automated inspection is advancing, but reliability and fit-for-purpose remain the key questions.
Keep humans in the loop where risk is high
Black-box models are a bad fit when the product is safety-critical or heavily regulated. Engineers need to know why a model is flagging a batch, not just that it is. That's why explainable models and human review still matter, especially when a model is making a recommendation that affects release, quarantine, or process adjustment.
If a model can't be challenged by an engineer, it's not ready for a high-consequence QC decision.
The practical place to start is narrow. Use AI on one line, one family of defects, or one repeated root-cause problem. Give it a clean data stream, a clear decision owner, and a measurable outcome. That keeps the workflow grounded in manufacturing reality instead of turning into a science project.
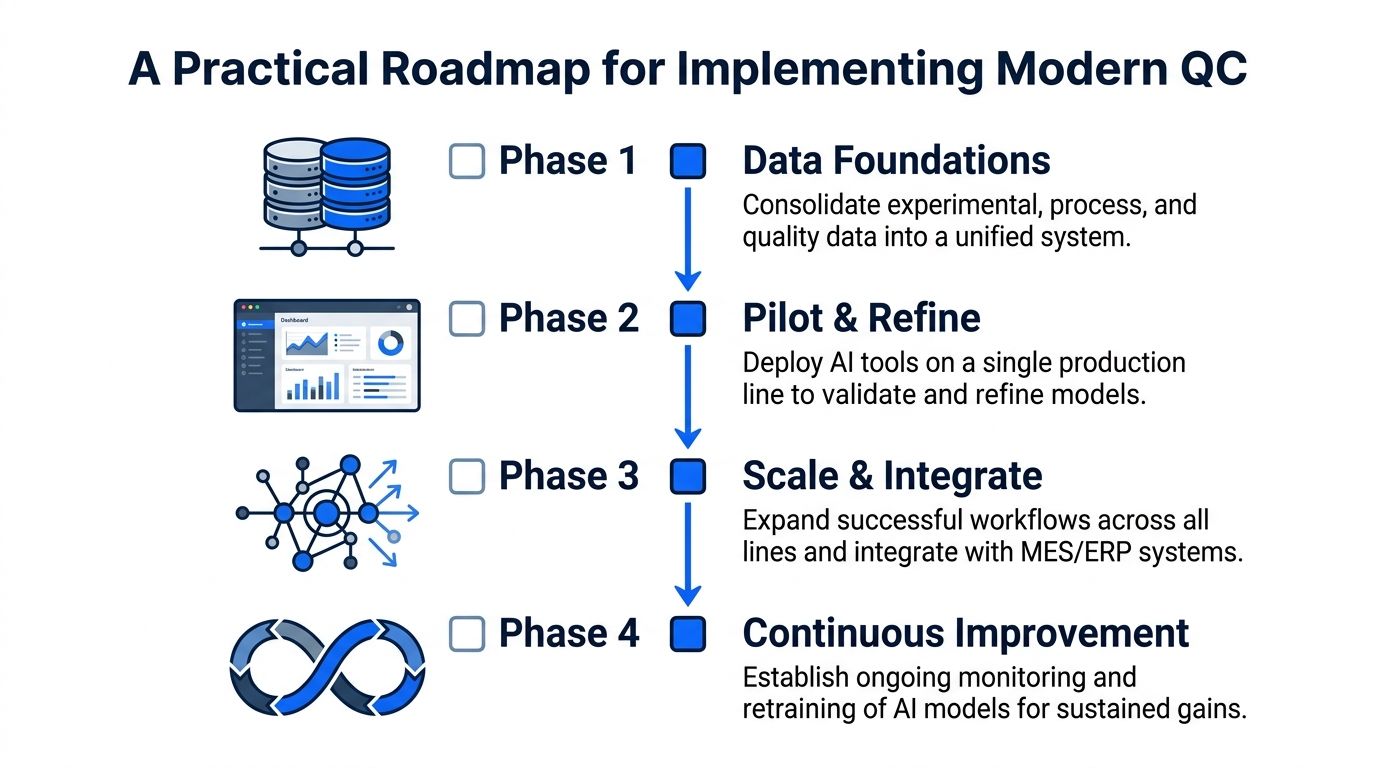
A Practical Roadmap for Implementing Modern QC
A modern QC program falls apart when data, ownership, and change control are fuzzy. The cleanest rollout is phased, because every plant has different legacy systems, different maturity, and different tolerance for disruption.
Phase one starts with data you can trust
Consolidate experimental, process, and quality records into a system people can query without rebuilding spreadsheets by hand. That includes lab results, pilot notes, machine settings, inspection records, and deviations. If teams can't connect those records, they can't trace why quality moved.
Then define ownership. Someone has to decide which team maintains master data, who approves changes to specifications, and who validates new fields before they go live. In regulated or enterprise settings, this also means keeping access controls, auditability, and security expectations in view, including standards such as ISO 27001 and SOC 2 where they apply operationally.
Phase two is baseline control
Before anyone introduces AI, establish a credible SPC baseline on critical variables. That tells you whether the process is stable enough for model training and whether the control limits are real or just hopeful guesses. It also helps distinguish ordinary variation from the special causes that deserve escalation.
Practical rule: don't automate a process you can't explain on a whiteboard.
Phase three narrows risk with characteristic classification
Not every characteristic deserves the same level of testing. Safety-critical, documentation-critical, functional, and non-critical attributes should not all be handled with the same inspection intensity. That kind of risk-based thinking is what keeps teams from wasting time on over-inspection while still protecting high-consequence features.
Phase four pilots AI in a controlled slice
Start with one use case, one line, and one clear success metric. Validate the model against historical cases first, then run it in parallel with human judgment before any automated action is allowed. If it proves useful, expand it carefully and wire it into MES or ERP workflows where appropriate.
The best programs keep the loop alive. Models get retrained, thresholds get reviewed, and control plans get audited when the process changes. QC is never finished, because the process never stops changing.
Case Examples and KPIs That Prove It Works
A polymer film team moved away from relying on final inspection alone and started charting critical-to-quality variables on the line. Operators watched the live trend instead of waiting for a reject bin, and the engineering team used FPY, capability, and deviation logs to decide when to intervene. The result was less rework, faster escalation, and a cleaner handoff between development and production.
A specialty materials group kept its existing FMEA in place and layered predictive quality plus anomaly detection on top of it. The model didn't replace engineers. It helped them focus on the batches most likely to need review and shortened the path from symptom to cause. The useful KPI set was small, FPY, Cp/Cpk, cost of poor quality, and time-to-root-cause.
The lesson is straightforward. Modern QC works when the dashboard reflects the process, not just the last inspection point. If those four KPIs are moving the right way, the program is doing real work.
If you're building a QC system for polymers, chemicals, or advanced materials, Polymerize can help connect lab data, process data, and quality signals in one place so you can move from formulation to scale-up with less guesswork. Explore Polymerize if you want a data backbone that supports statistical control, traceability, and AI-assisted decision-making across the full materials workflow.
Put your R&D data to work
See how materials teams use Polymerize to plan fewer experiments and reach target properties faster.