


You've got a formulation that refuses to behave. The adhesion target is clear, the tensile spec is clear, and the input list keeps growing, monomer ratios, catalyst loading, temperature ramps, mixing speed, hold times, initiator level, maybe even a few “just in case” variables someone added because the last DOE was inconclusive. In that situation, parameter sensitivity analysis is the fastest way to stop guessing which knobs matter and start spending lab time where it can change the outcome.
For materials teams, the real value isn't a pretty ranking table. It's the ability to simplify the model, prioritize experiments, and separate the few variables worth tight control from the many you can safely hold constant. That's why the most useful sensitivity work looks a lot like good design judgment, and not much like a slide deck trophy. Even outside materials, the same idea shows up in fields where the input space is messy and the cost of exploring it is high, whether that's a model of a physical system or a workflow like medical illustrators in legal work, where the team has to decide which variables really affect the final result.
Table of Contents
- Define the Input Space with Physical Meaning
- Sample the Space with the Right Design
- Run the Analysis on the Right Model
- Read the Results as a Map, Not a Scorecard
- Validate Against Domain Knowledge
Why Formulation Chemists Need Parameter Sensitivity Analysis
A formulation chemist staring at 15 inputs doesn't need another broad theory of optimization. They need to know which three variables are driving tensile strength, glass transition temperature, adhesion, or cure behavior, because the lab can't afford to explore all combinations with brute force. Full factorial designs collapse under that kind of dimensionality, and one-factor-at-a-time studies miss the interactions that usually explain why a “good” recipe fails at scale.
That's where parameter sensitivity analysis earns its keep. It gives a disciplined answer to a practical question, which inputs move the output, which inputs only matter in combination, and which inputs can be fixed without regret. In a polymer setting, that can mean discovering that a solvent ratio barely matters on its own, but becomes decisive only when temperature and mixing energy shift together. In that case, a simple correlation screen would miss the story entirely.
Correlation Is Not the Same as Sensitivity
Correlation can tell you that two variables travel together in historical data. Sensitivity analysis asks a different question, what happens to the output when the input changes, while everything else is held within a defined space. That difference matters when the data were collected opportunistically, because historical experiments often cluster around a few familiar recipes and don't cover the full formulation domain.
Practical rule: if the team wants to decide what to fix, what to measure more carefully, and what to leave alone, sensitivity analysis is the right tool. If the team only wants a rough association, correlation is enough, but it won't support experimental prioritization.
That distinction also explains why AI-guided experimentation benefits from sensitivity work early, not late. A surrogate model can only help if the input space is organized well enough for the model to learn what drives the response. Without sensitivity analysis, teams often train fast on the wrong variables, then spend the next cycle repairing the experiment plan instead of advancing the formulation.
The value is often immediate. A few hours of structured analysis can spare weeks of dead-end DOE runs because it tells the team where the signal lives. That makes the method less like a statistical luxury and more like a decision filter for materials R&D.
Core Concepts Behind Sensitivity Analysis Methods
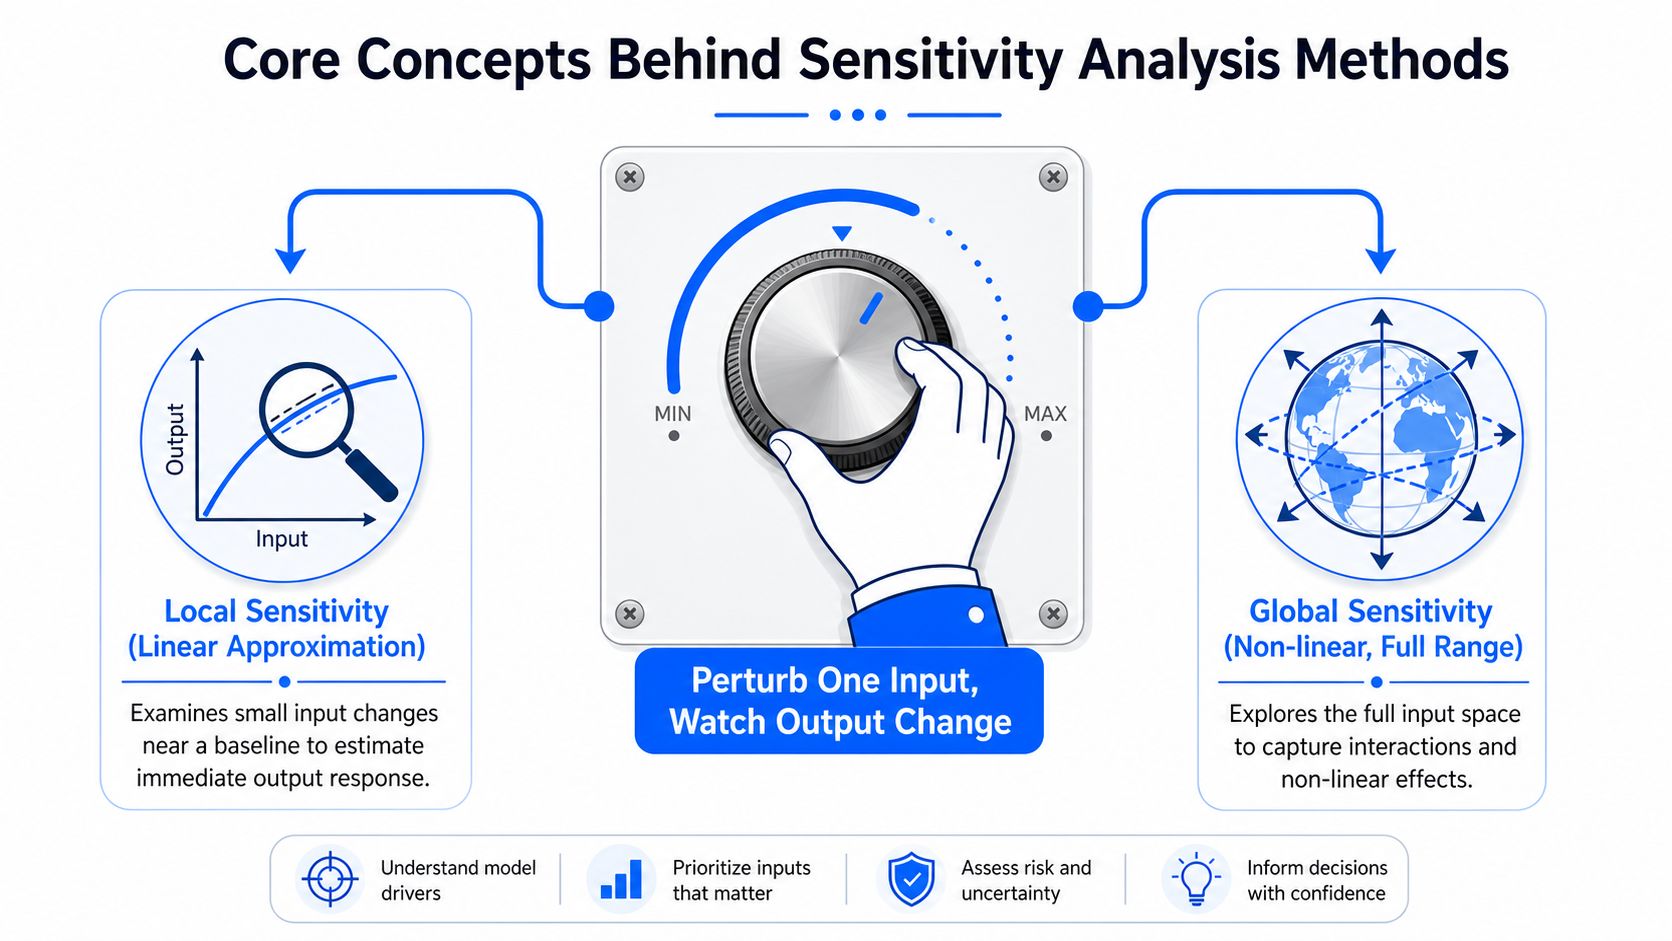
At the simplest level, sensitivity analysis starts with a tiny perturbation. Change one input, watch the output move, and ask whether the change is large enough to matter. In a polymer blend, that's like tasting a soup, adding a pinch of salt, and checking whether the flavor changes in a way you can use. If the answer is yes, that ingredient deserves attention. If not, it probably doesn't need a front-row seat in the next experiment.
Local Sensitivity and Global Sensitivity
Local sensitivity looks at one point in the input space. It tells you how steep the response is near the current recipe, which is useful when you're tuning a known formulation near its operating window. Global sensitivity looks across the broader input space, so it can catch curved behavior and interactions that local derivatives won't show.
That difference is why local methods are fast but fragile. They work well when the model is smooth and the question is narrow. Global methods are slower, but they're better when the team is still choosing between broad formulation families or testing whether a new additive system changes the response.
Variance Decomposition as the Backbone
For many materials applications, the most useful mental model is variance decomposition. The total variation in the output is split into parts that come from each input and from interactions among inputs. A first-order index captures the main effect of one input. A total-order index captures that same main effect plus every interaction involving that input.
In a blend analogy, first-order effects answer, “Does this ingredient matter by itself?” Total-order effects ask, “Does this ingredient matter once it starts mixing with the rest of the recipe?” That's the number a formulation team needs when interaction effects are common, which is often the case in polymers, coatings, and reactive systems.
A low main effect is not the same as low importance. In a coupled formulation, a parameter can look quiet alone and still be essential once the rest of the recipe changes.
That's the vocabulary worth keeping in mind. Local versus global. Main effect versus interaction effect. Once those ideas are clear, the method choice becomes much easier to defend in front of a lab manager or project lead.
Comparing Sensitivity Analysis Methods for Materials R&D
Different methods solve different problems, and the wrong one can waste just as much time as no analysis at all. The best choice depends on how many variables you're carrying, whether the model is physics-based or data-driven, and how much compute or experimental budget you can spend. Screening methods are useful when the question is, “What can I safely ignore?” Variance-based methods are better when the question is, “How much does each factor contribute, including interactions?” Derivative methods fit smooth models where gradients are cheap. Machine-learning feature importance methods help when the surrogate is already trained and the team wants a quick ranking.
Choosing the Right Method for the Job
Morris screening is the workhorse for wide input spaces. It's especially useful when you have a lot of parameters and need to eliminate the obvious non-influencers before spending serious resources. Sobol-style methods are heavier, but they're the standard when you need defensible decomposition of effects and interactions. Derivative-based approaches are excellent for smooth simulation models or differentiable surrogates, while permutation importance and tree-based importance are practical for random forests and gradient boosting models.
The point is not to worship one method. The point is to match the method to the decision you need to make.
| Scenario | Parameter Count | Model Type | Recommended Method | Key Advantage |
|---|---|---|---|---|
| Early screen on a large formulation set | High | Experimental or simulation-based | Morris screening | Quickly flags non-influential inputs |
| Need interaction-aware contribution estimates | Moderate to high | Physics-based or surrogate | Sobol indices | Separates main effects from interactions |
| Smooth model with available gradients | Moderate | Differentiable simulation or surrogate | Derivative-based sensitivity | Efficient when gradients are cheap |
| Trained random forest or boosting model | Moderate | Data-driven surrogate | Permutation or feature importance | Fast ranking from an existing model |
| Tight compute budget and limited runs | High | Any model with expensive evaluations | Screen first, then refine | Avoids overcommitting to costly analysis |
What Works in Practice
A common mistake is to start with the most advanced method because it looks rigorous in a paper. That's backwards in materials R&D. If the team already suspects that only a few variables matter, screening is often enough to prune the list before deeper analysis. If the formulation is highly interactive, a variance-based method is worth the cost because a single ranking won't tell you which inputs matter together.
The 2023 HESS study on watershed classification is a good reminder that sensitivity is not always a single global ranking exercise. The authors showed that classifying watersheds by climate and vegetation could reveal spatial patterns of parameter sensitivity in a VIC model at reduced cost, and they argued that this can greatly improve efficiency for large spatial domains. That same logic applies to materials systems with different operating regimes, because a variable that dominates one subregion may be secondary in another. HESS study on spatial patterns of parameter sensitivity
Step-by-Step Workflow for Running Sensitivity Analysis
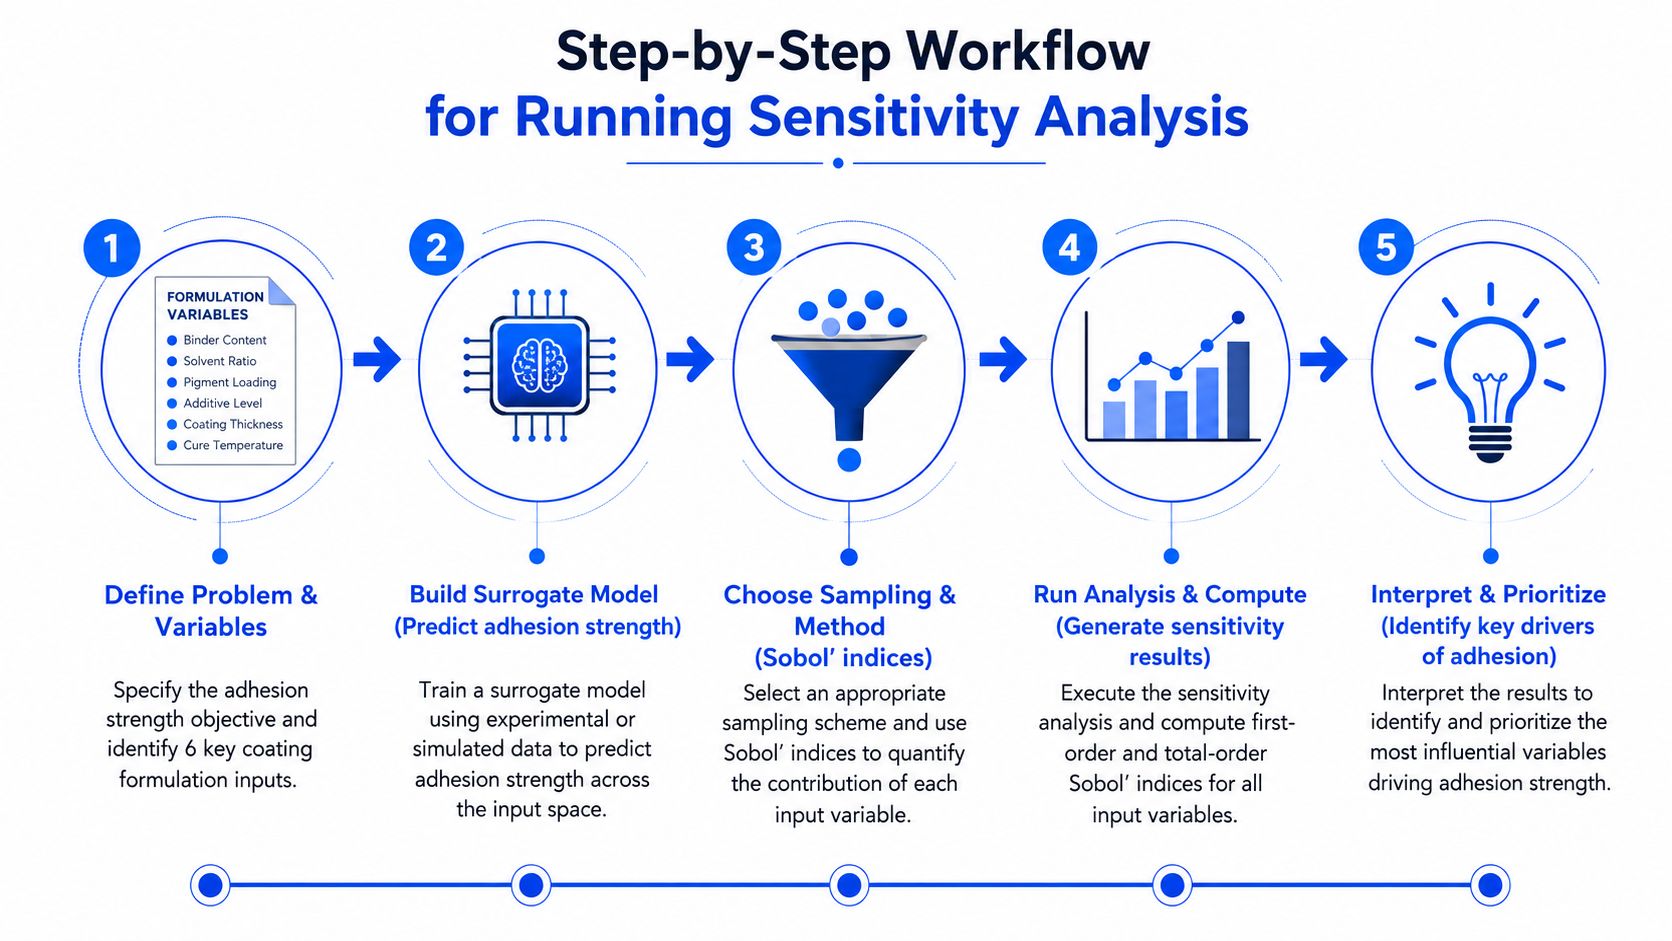
A coating adhesion project is a clean example because the team usually has a trained surrogate, a manageable set of inputs, and a concrete target property. Six formulation variables might include resin ratio, crosslinker level, solvent fraction, curing temperature, cure time, and mixing rate. The workflow works best when those inputs are defined in engineering terms first, not in arbitrary statistical ranges someone copied from the last project.
Before the steps start, it helps to remember that the goal isn't just analysis, it's decision quality. A sensitivity run that doesn't change the experiment plan isn't doing its job.
The video below is useful if you want a quick visual pass on the overall process before you build your own workflow.
Define the Input Space with Physical Meaning
Set bounds that reflect chemistry and processing reality. If a crosslinker level can't practically exceed a certain solubility limit, don't include fantasy values just because they make the statistics easier. Categorical variables, like monomer type, need careful handling because they don't behave like continuous knobs.
Sample the Space with the Right Design
Latin hypercube sampling is often a good start when you need broad coverage without wasting runs. Sobol sequences are useful when you want a more uniform spread for global methods. The main point is consistency, because uneven sampling can make a surrogate look confident in the wrong places.
Run the Analysis on the Right Model
If you have raw experimental data, start by checking whether the relationships are clean enough for the method you chose. If you're using a trained surrogate, confirm that the surrogate itself is trustworthy before reading the sensitivity results as if they came from the lab bench. Sensitivity analysis only helps when the model is already describing the system credibly.
Read the Results as a Map, Not a Scorecard
Tornado plots help stakeholders see which variables move the response most strongly at the chosen operating point. Interaction heatmaps show where parameters behave as pairs rather than as isolated drivers. That second view is often where the most useful formulation insight hides.
Validate Against Domain Knowledge
A good result should make physical sense, even when it's surprising. If it doesn't, check the sampling scheme, the output definition, and whether the model was extrapolating beyond the formulation envelope. That discipline matters in polymer work because small modeling shortcuts can create false confidence fast.
For teams trying to build repeatable R&D workflows around experiments and AI, a useful reference point is publish your show faster with AI, not because the application is the same, but because the workflow logic is similar, define inputs carefully, automate the repetitive steps, and keep the human judgment focused on the decisions that matter.
Interpreting Results and Avoiding Common Pitfalls
Misreading sensitivity indices is easy, especially when the team wants a fast answer. The most common error is treating a low first-order index as proof that a parameter doesn't matter. In an interactive system, that parameter may contribute little on its own and still be essential through combinations with other inputs, which shows up in the total-order index instead.
Read Main Effects and Interactions Together
A useful signal is when the sum of first-order indices is clearly below one. That usually means interactions are carrying a meaningful part of the output variance, so the model deserves more than a simple ranking. In formulation work, that's often the clue that a mixture design or response surface study will outperform a narrow screening plan.
Another trap is extrapolating sensitivity results from a tight input range to the full formulation space. A parameter can look unimportant near the current recipe and become dominant when the system is pushed toward another cure schedule, another filler loading, or another solvent balance. That is why the chosen bounds matter as much as the algorithm.
Good practice: treat the sensitivity table as context-bound evidence, not as a universal law of the formulation.
Watch for Correlated Inputs
Correlated inputs distort importance rankings because the method can't cleanly separate their effects. Experimental datasets often have this problem when the lab tends to move variables together, such as changing catalyst level and temperature in the same direction. The fix is not to ignore the correlation, it's to redesign the experiment or choose a modeling strategy that acknowledges the dependency.
A before-and-after example is common in coatings. Before correction, a team may think solvent fraction is the main driver because it appears strong in the historical data. After they rerun the analysis with a better-defined input space, they find that solvent fraction mainly acts through cure kinetics, so the next experiments shift toward thermal history instead of solvent tweaks. That change saves time because the team stops chasing a variable that only looked dominant in a biased dataset.
Another version happens in polymer blends. A filler level may appear unimportant until the team examines its interaction with mixing energy, then the path to better performance becomes obvious. The lesson is simple. Read the numbers with the same skepticism you'd use for an unexpected analytical chemistry result.
Using Sensitivity Analysis for Experimental Prioritization
The strongest use of sensitivity analysis is not ranking for its own sake. It is deciding what to do next. When a parameter has near-zero total-order effect across the chosen space, it becomes a candidate for fixing as a constant, which narrows the experimental design immediately and keeps the team from spending runs on variables that won't move the target.
Turn Indices into an Experiment Plan
High-interaction parameters need a different response. They usually justify mixture designs, response surface methods, or a broader surrogate retraining cycle instead of a simple screening study. That's because the decision isn't just whether the factor matters, it's whether the factor matters by itself or only when paired with something else.
Use Sensitivity to Simplify the Model
Model simplification is where the payoff compounds. Removing insensitive inputs makes surrogates easier to train, easier to explain, and easier to update when fresh experimental data arrive. It also reduces the number of knobs a process engineer has to monitor during scale-up, which matters when the lab recipe moves into manufacturing reality.
This is also where recent practice still lags behind theory. A 2023 review found that sensitivity analysis is often not used systematically, even though standard references treat it as a way to identify influential inputs, reduce complexity, and decide which variables deserve more data collection or can be fixed as constants. In nonlinear programming, the growing focus on how solutions change with parameter shifts points in the same direction, toward decision-oriented analysis rather than a static coefficient list. Review and decision-oriented sensitivity discussion
The practical result is a tighter loop. Sensitivity analysis informs the next experiment, the next experiment improves the surrogate, and the improved surrogate sharpens the next round of prioritization. That cycle is what makes the method valuable in real materials R&D, because it keeps the team focused on the few variables that keep changing the outcome.
Practical Templates and Best Practices for Your Next Project
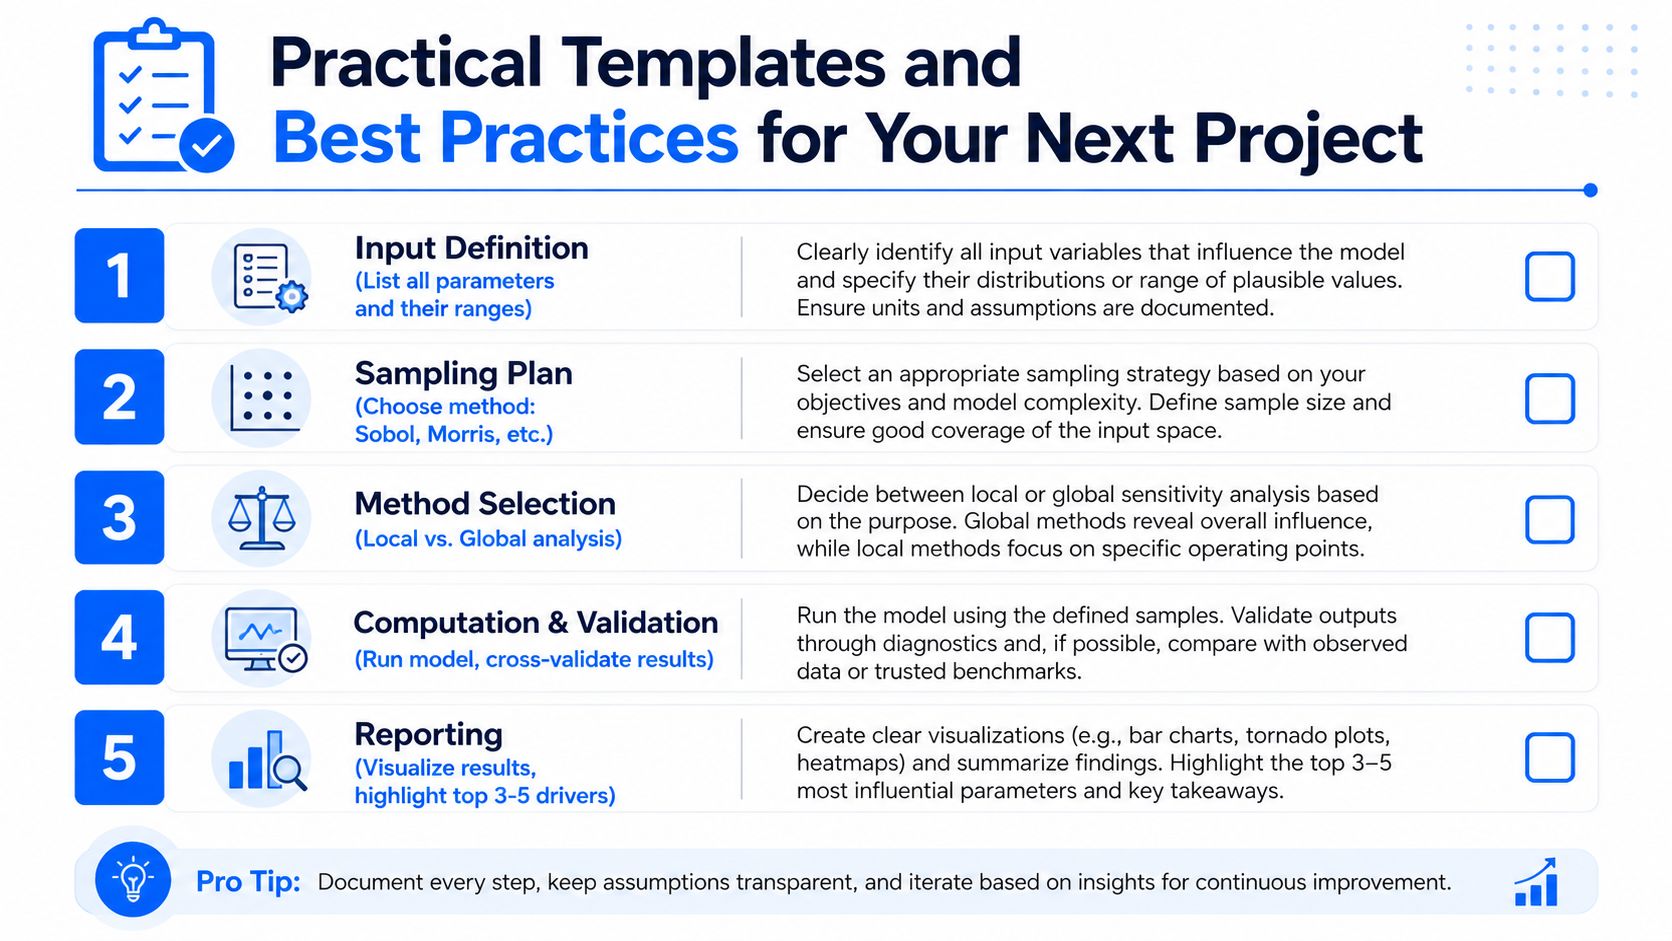
A solid sensitivity study starts with a short checklist, not a complicated workflow chart. Define each input in physical terms, record the bounds, pick a method that matches the model and budget, run the analysis on a surrogate or simulation you trust, and validate the output against chemistry and process knowledge. If the goal is stakeholder alignment, show a tornado plot first, then add interaction details only where they help the decision.
A Simple Project Template
- Input Definition. List every parameter, its units, and the range justified by chemistry or process constraints.
- Sampling Plan. Choose Morris, Sobol, or a derivative method based on the number of variables and compute budget.
- Method Selection. Use local sensitivity near a known operating point, global sensitivity when the formulation space is still broad.
- Computation and Validation. Re-run at increasing sample sizes and check whether the indices stabilize.
- Reporting. Highlight the top drivers, the interaction pairs, and the inputs that can be fixed.
Two habits save the most time. Start with screening before committing to expensive global computations, and document why each bound is defensible. Those two steps keep the analysis tied to the actual product problem instead of a mathematical sandbox.
For teams building AI-native materials workflows, the best setup is one where the surrogate model keeps learning from each new experiment and the sensitivity analysis updates with it. That way, the ranking doesn't sit in a report, it stays connected to the next decision the lab has to make.
If you're ready to turn sensitivity analysis into a working part of your formulation workflow, take one active project this week and run the framework on the system where wasted experiments hurt the most. Polymerize helps materials teams connect fragmented data, build explainable models, and prioritize the next best experiment instead of guessing, so if that's the kind of R&D loop you want, visit Polymerize and see how it fits into your current formulation program.
Put your R&D data to work
See how materials teams use Polymerize to plan fewer experiments and reach target properties faster.