

Your month-end deck looks good. The line hit its target, the pilot ran cleanly, and one team can point to a neat local win. Then someone asks why overall yield is flat, why the same defects keep resurfacing on another line, and why the plant still feels stuck in firefighting mode.
That gap is where manufacturing process improvement usually fails. The issue is rarely a lack of effort, it's a lack of shared data, decision rules, and system-level tradeoffs. Lean tools still matter, but in multi-line, multi-product operations, the problem is deciding which change improves the whole system instead of just making one area look better on paper.
Table of Contents
Why Most Manufacturing Process Improvement Programs Stall
A formulation plant leader once told me the same story in slightly different language every quarter. One emulsion line shaved a meaningful amount off cycle time, the dashboard turned greener, and the team celebrated because the project had delivered exactly what it promised. Meanwhile, a second line started bleeding yield, changeovers got longer, and the quarterly review turned into a debate about whether the “win” was really a win.
That pattern persists because most programs reward local optimization. A single team fixes its own bottleneck, measures success by its own KPI, and moves on before anyone checks whether the change shifted load elsewhere in the plant. The result is familiar, isolated improvements that look efficient in a meeting but don't change the throughput, quality, or cost of the overall system.
A stronger reference point is the engineering discipline behind the work, not just the improvement slogan. A useful companion is the engineering guide from Sheridan Technologies, because it reflects the practical truth that process engineering is about how flows, constraints, and controls work together, not just about removing visible waste.
Why dashboards multiply without decisions changing
Plants often have plenty of metrics and still lack decision clarity. Teams track downtime, defects, scrap, and cycle time, but the numbers live in separate tools, or they're reported at different cadences, so no one can see the full cause-and-effect chain fast enough to act.
The common checklist, identify waste, analyze root causes, monitor KPIs, is useful but incomplete for multi-line manufacturers. It assumes the right problem is already obvious and that a local fix won't create a new constraint somewhere else. In practice, that assumption is often wrong.
Practical rule: if a project can't show how it changes total system capacity, it probably isn't an improvement program, it's a localized cleanup.
That's why this topic needs a different lens. Manufacturing process improvement scales when data is unified, tradeoffs are explicit, and the team makes repeatable decisions about where to intervene. Once you start managing the portfolio instead of just the line, the conversation changes from “did we fix this station?” to “did we improve the plant?”
Building a Diagnostic Baseline You Can Trust
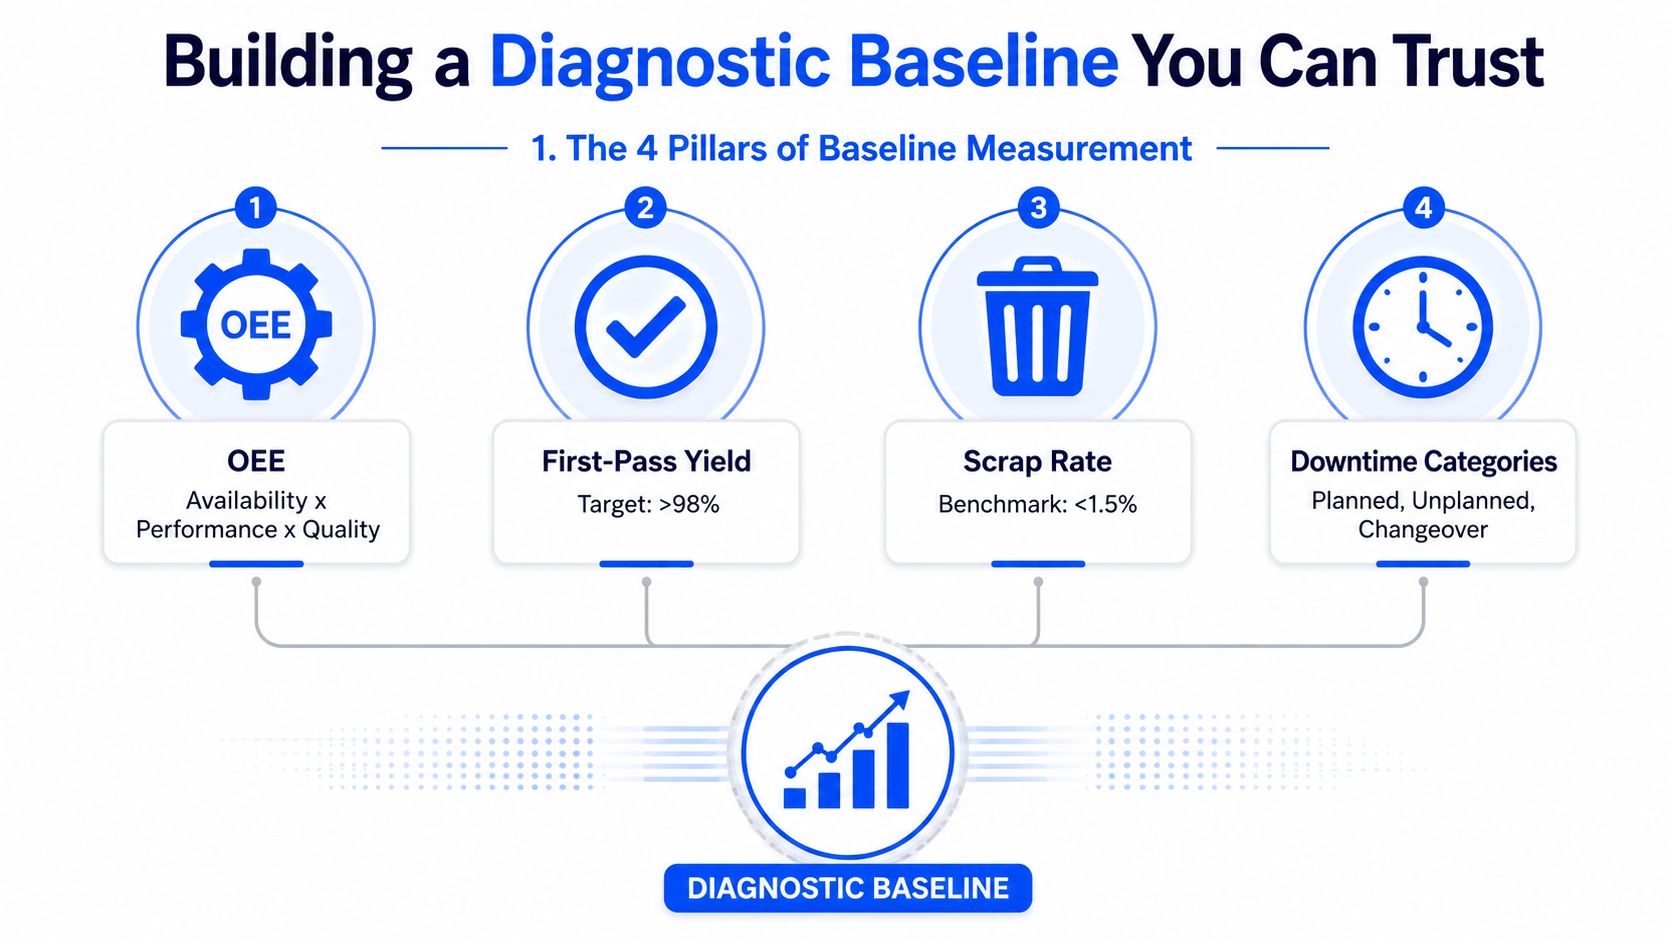
Before anyone approves a fix, the baseline has to hold up under scrutiny. The team needs a measurement set it can defend when operations, quality, and finance all ask different questions about the same process. In manufacturing, that usually starts with Overall Equipment Effectiveness (OEE), first-pass yield, scrap, downtime, and lead time.
OEE tells you whether the plant is really improving
OEE is a useful anchor because it combines availability, performance, and quality into one operational picture. A common industry average sits around 40 to 60 percent OEE, while a world-class target is 85 percent or higher oxmaint.ai manufacturing KPI dashboard reference. That gap is large enough to force honest questions about where the losses live.
Downtime should be broken into categories, not reported as one vague bucket. Average plants often sit at 15 to 25 percent downtime, while best-in-class operations stay under 5 percent. If the team cannot distinguish planned stops from unplanned stops and changeover loss, it will chase the wrong fix and call it progress.
The six numbers worth knowing by memory
A strong improvement leader should be able to recite these without opening a deck:
- OEE trend: Know whether the site is operating in the average range or approaching world-class performance.
- Availability: Know whether equipment uptime is where it needs to be for the process.
- First-pass yield: Know whether work is passing through without rework or hidden correction loops.
- Scrap rate: Know whether waste is below the top-performing benchmark of under 1 percent.
- Downtime split: Know how much is planned, unplanned, and changeover-related.
- Lead time decomposition: Know how much time is spent in procurement, production, quality assurance, and shipping.
Rule of thumb: if a KPI cannot change a decision this week, it is probably vanity data.
Lead time matters because it captures the full path from conception to delivery, not just the machine run. That makes it a better management metric than a narrow machine score when the core problem spans procurement, batching, quality checks, and logistics. In the better programs, the baseline stays small, explicit, and shared, so every later improvement can be checked against the same source of truth.
Running a DMAIC Cycle That Produces Verifiable Gains
DMAIC works when each phase produces evidence, not just activity. Define frames the problem tightly, Measure establishes the actual baseline, Analyze isolates root causes, Improve tests the fix, and Control locks it in so the gain doesn't evaporate after the team moves on. That sequence sounds simple until someone tries to skip the measurement work and jump straight to the fix.
A published Six Sigma case on rubber weather strips shows why the discipline matters. The daily rejection rate fell from 5.5 percent to 3.08 percent, first-pass yield improved from 94.86 percent to 99.48 percent in three months, and monthly compound cost dropped by Rs. 15,249 PMC case study. That isn't a motivational story, it's a measured result tied to a defined process.
What each DMAIC phase should leave behind
Each step should produce a hard artifact before the team advances.
- Define: a narrowly scoped problem statement, a named process owner, and a clear defect definition.
- Measure: a baseline with data sources, sampling rules, and a downtime or defect taxonomy everyone agrees on.
- Analyze: a validated root cause, not a list of possibilities.
- Improve: pilot results that show the change worked under real operating conditions.
- Control: a written control plan, monitoring cadence, and escalation path if the metric drifts.
A crankshaft manufacturing line study makes the same point from a more complex process. Rejection dropped from 7.53 percent to 2.8 percent, then settled at 1.88 percent after corrective actions, with defect-specific reductions of 35.80 percent to 69.46 percent across multiple modes and annual savings of Rs. 5.5 lakh Scientific Reports case study. The important lesson is not just the savings, it's that defect categories were measured separately, corrected separately, and then verified again.
Done means the gain is controlled, not just achieved
Too many teams call a project complete at the first green result. That's premature. A process change isn't real until the control plan catches drift, the operators can follow the new standard work, and the defect trend stays stable after the initial attention fades.
If the analysis is strong but the control step is weak, the plant gets a temporary improvement and a permanent memory of how it failed.
DMAIC is useful because it keeps improvement statistical instead of emotional. It forces teams to prove that the cause they removed was the cause of the loss, and it makes the result portable for audits, replication, and scale-up. That's the difference between a good idea and a defensible manufacturing change.
When AI and Data Unification Beat Traditional Lean
Lean and Six Sigma still do the heavy lifting in stable processes. They work best where the problem is visible, the variation is manageable, and the team can get to the shop floor quickly. The limits show up when the process is data-fragmented, formulation-heavy, and too dynamic for a quarterly improvement cycle.
The main reason to use AI-guided improvement is repetition under uncertainty. When scientists and engineers are making the same decision every week, across spreadsheets, ELNs, and hand-copied reports, fragmented data becomes the bottleneck. A unified data backbone matters more than another dashboard.
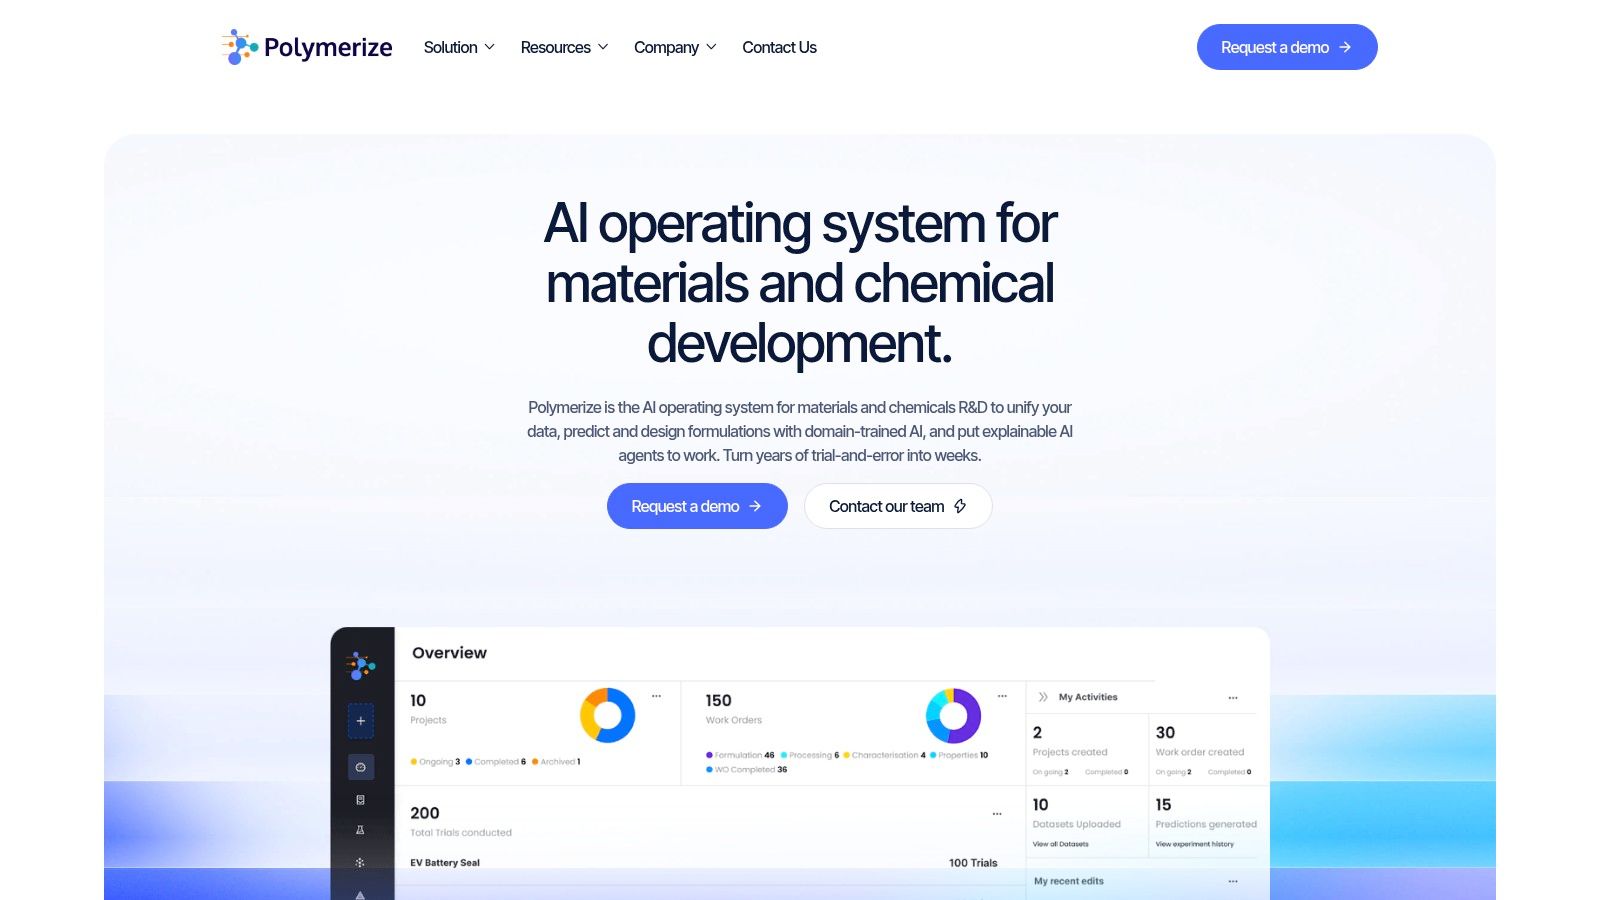
The image below shows the practical shift from isolated analysis to a data-connected workflow.
Where digital tools earn their keep
AI and data unification make sense when a process has several of these traits at once:
- High variability: results move around too much for simple rule-based tuning.
- Complex formulations: small changes can shift multiple properties at once.
- Fragmented records: critical history sits across spreadsheets, ELNs, and local files.
- Frequent decisions: the team needs a next-best action every week, not once a year.
- Explainability needs: scientists need to see why a model recommends a change.
A platform like Polymerize is relevant in that setting. Polymerize Connect unifies experimental data into a centralized backbone, and Polymerize Labs layers 35+ explainable models for property prediction, formulation optimization, and causal-driver surfacing with confidence scores and historical precedents, so teams can choose the next experiment with context instead of guesswork Polymerize platform overview.
Lean or AI-guided experimentation
The choice is practical, not ideological. It comes down to data maturity and decision frequency.
- Use Lean or DMAIC when the process is visible, the defect source is local, and the team needs to remove waste from a stable flow.
- Use AI-guided experimentation when the data is scattered, the formulation space is large, and every pilot run is expensive.
- Use both when the lab and the plant share the same measurement language and the organization can act on model outputs quickly.
Bottom line: digital tools do not replace root-cause thinking, they make it faster only when the underlying data is trustworthy.
A short video is useful here because many teams can see the difference faster than they can describe it on a slide.
The wrong move is buying software to compensate for unclear ownership or dirty inputs. The right move is using AI and unification to shorten the time between observation, hypothesis, and validated decision. That is where digital approaches beat a traditional checklist.
Prioritizing Improvements Across Lines, Plants, and Products
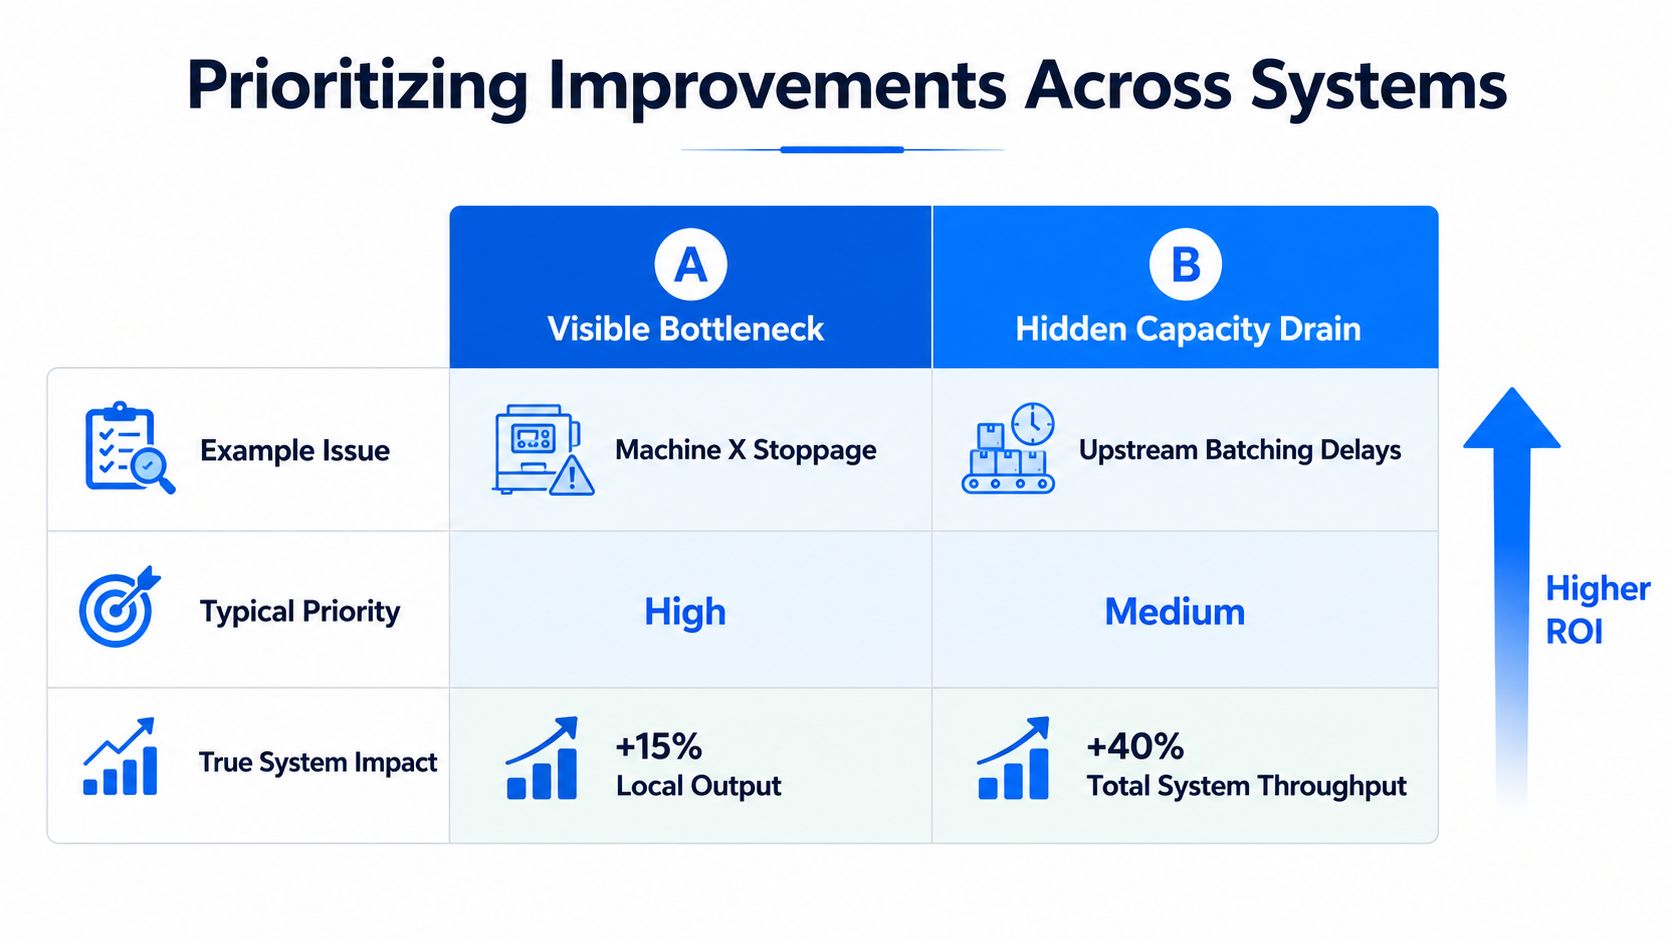
The most visible bottleneck is not always the highest-ROI fix. A machine that stops often gets attention fast, but a less visible upstream delay or batching mismatch can choke the whole system more severely. In multi-line operations, the team needs a portfolio rule, not a first-come, loudest-complaint rule.
Score the work against total system capacity
The simplest prioritization worksheet should rate each candidate improvement on three questions.
- How much constrained capacity does it free up?
- What side effects does it create on adjacent lines, upstream supply, or downstream QA?
- How much changeover, rework, or operating complexity does it add elsewhere?
That logic matters because fixing one area can reallocate losses instead of eliminating them. If Line A runs faster but now starves Line B, the plant hasn't gained capacity, it has moved the constraint. This is the quiet failure mode that makes otherwise good programs underperform.
What popular guidance gets right, and what it misses
Most process-improvement guidance tells teams to fix the biggest loss first or benchmark downtime categories. That advice is useful, and it's usually where a plant should start. The gap is that it rarely explains how to compare improvements across a whole portfolio when the “largest” issue on one line creates a worse constraint somewhere else.
A practical scoring sheet can stay simple:
- System impact: high, medium, or low.
- Cross-line risk: whether another line absorbs the burden.
- Implementation complexity: how much coordination is required.
- Measurement confidence: whether the effect can be verified quickly.
Practical rule: choose the project that improves total flow with the least collateral damage, not the one that produces the nicest local metric.
Senior operations teams often separate from heroic ones at this point. Heroic teams chase visible fires. Strong teams decide which loss reduces the entire plant's drag, then protect that decision from local politics. That's how manufacturing process improvement becomes a portfolio discipline instead of a series of disconnected wins.
Scaling Improvements From Lab to Line Without Losing the Gain
A lab win can disappear on the factory floor when the hand-off is weak. The chemistry may be sound, but scale-up still fails if the production team never sees the same data, the same acceptance criteria, or the same assumptions that made the lab result work. In practice, the break usually comes from governance and data continuity, not from the formulation itself.
A clean scale-up path starts with a pilot design that includes validation gates before anyone commits to production volume. Set the target property, define the allowed process window, run a DOE where it matters, and agree on what counts as success at each gate. If the team cannot point to the data that proves readiness, it is not ready to scale.
Build the hand-off around the same source of truth
The data backbone that helps scientists in the lab has to become the source of truth on the floor. Otherwise, production inherits a story instead of a reproducible method. Material hand-offs should include formulation history, test conditions, acceptance thresholds, and deviations in one place.
AI-guided experimentation also helps shorten the loop between hypothesis and validated change. Customers of AI-native materials R&D platforms like Polymerize report faster scale-up from lab to production and fewer failed experiments within the same early cycle, with explainable models that surface causal drivers and historical precedents so scientists can choose the next best experiment instead of guessing. That kind of setup reduces wasted pilots and keeps the scale-up conversation tied to evidence, not memory.
A workable 30, 60, 90 day scale-up rhythm
- First 30 days: align stakeholders, freeze the measurement definition, and validate the first pilot against the lab baseline.
- Days 31 to 60: run the production-side trial, compare the actual process window to the lab assumption set, and update the hand-off package.
- Days 61 to 90: confirm repeatability, train the operators, and formalize the control plan before volume ramps.
Change management is the part people underestimate. Scale-up fails as often because procurement, quality, operations, and R&D were not aligned as because the formulation missed spec. If those groups do not share the same artifacts, the organization ends up relitigating the same decision at every gate.
A practical lesson from bottleneck detection with AI tools is that the hand-off should make exceptions visible early, while the team still has room to adjust. The same discipline applies in materials R&D. If the material spec, process window, and control checks live in the same system, the transition depends less on memory and more on method.
Sustaining Gains With KPIs, Governance, and a 90-Day Plan
A process improvement only counts once it survives normal work. A project can launch cleanly, brief the steering committee well, and still slide backward after the team returns to daily production pressure. Holding the gain takes governance, not a celebrate-and-move-on mindset.
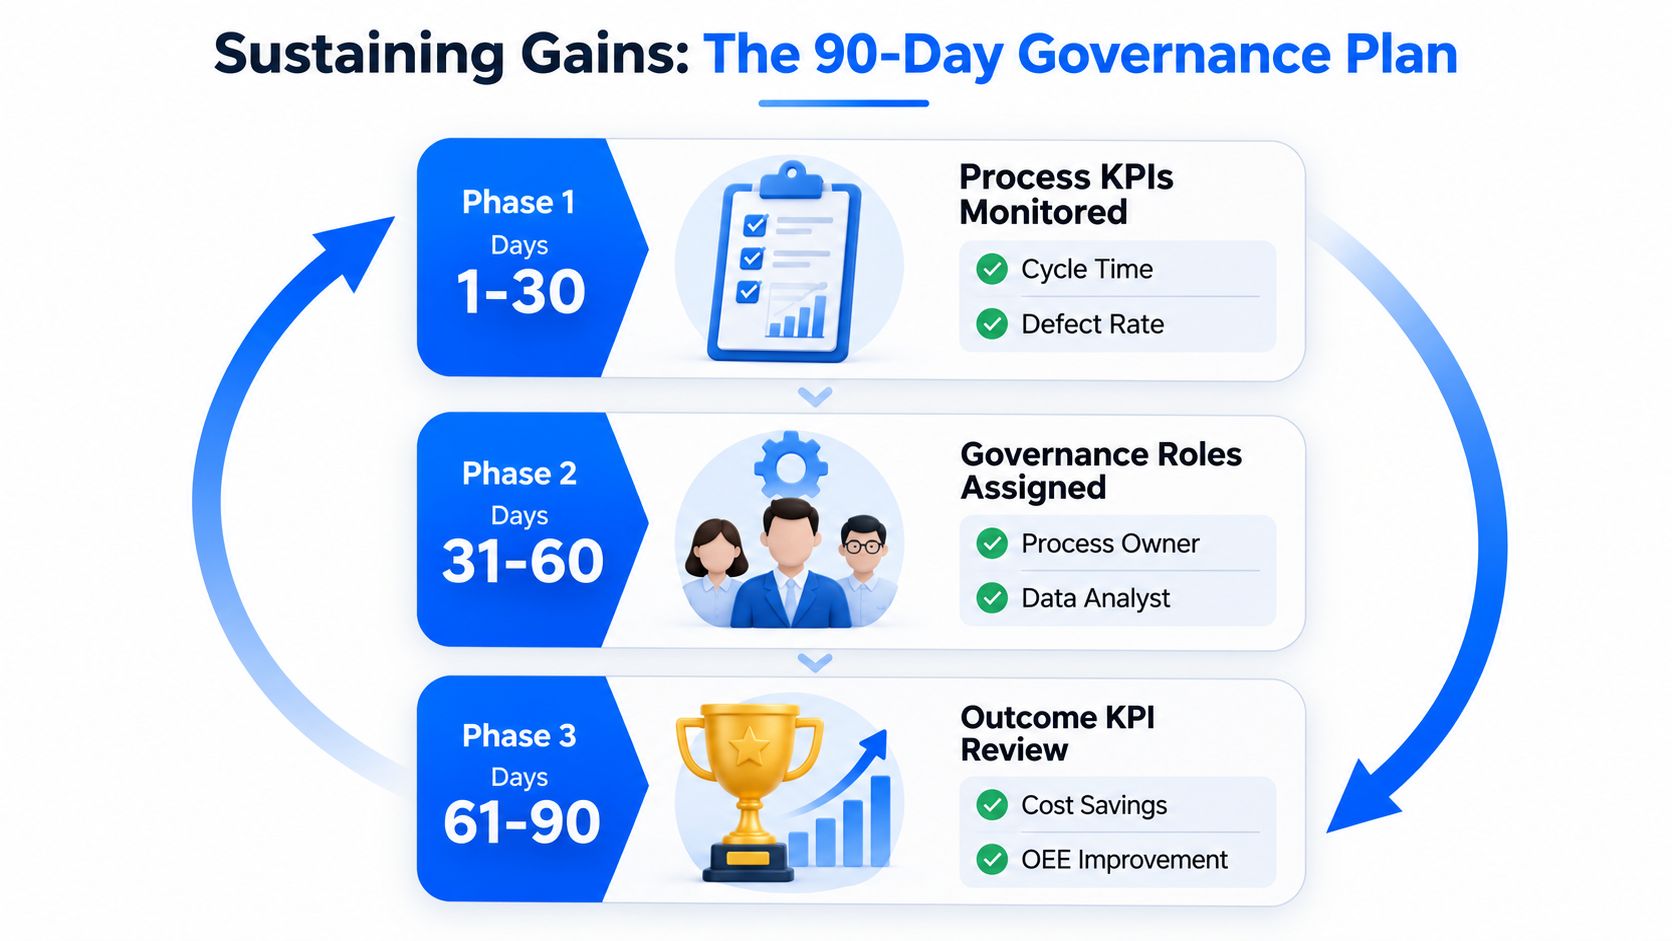
The image below is the simplest way to think about the post-launch rhythm.
Separate process KPIs from outcome KPIs
Process KPIs show whether the new standard is being followed. Outcome KPIs show whether the business got the benefit. Both matter, but they answer different questions.
A control plan should name a process owner, a data owner, and a review cadence. If nobody owns the data flow, the metric drifts. If nobody owns the operating standard, the old habit comes back.
A useful external reference for the monitoring mindset is the AI bottleneck detection discussion from Appjet.ai, because the governance problem is similar. You need a repeatable way to find constraints, review them, and respond before the system slides backward. In manufacturing, that means using the same discipline to catch loss trends early, not after the quarter closes.
A 90-day control rhythm that holds the gain
- Days 1 to 30: audit the control plan, check whether the process KPIs are being collected correctly, and confirm the team knows the trigger thresholds.
- Days 31 to 60: review the improvement portfolio across lines and make sure the local fix did not create a new bottleneck elsewhere.
- Days 61 to 90: revisit the baseline, compare the outcome KPIs against the original problem, and decide whether the change should be standardized or revised.
Early momentum matters too. In materials R&D workflows, customer-reported outcomes such as fewer failed experiments can be a useful sign that the data and decision loop are working, especially when the team has moved from guesswork to explainable recommendations Polymerize customer-reported results. That signal matters most when it is backed by written artifacts, not just verbal confidence.
The handover package should leave behind more than a slide. It should include the baseline, the root-cause evidence, the pilot data, the control plan, the owner list, and the review cadence. If the next team can inherit the process without hunting for the logic, the improvement has scaled.
Put your R&D data to work
See how materials teams use Polymerize to plan fewer experiments and reach target properties faster.