


A formulation screen can look perfectly healthy in the spreadsheet. Every well has a sample name, a measured property, and a promising trend. Then scale-up begins, and the apparent hit disappears. The cause may be as ordinary as a viscosity value entered in the wrong unit or a synthesis lot attached to the wrong batch date. In materials R&D, those small recording errors can redirect an entire experimental campaign.
Data quality metrics make those failures visible before they reach a model, a decision, or a larger reactor. The useful question isn't whether a dataset looks complete. It's whether the data is accurate enough, traceable enough, and timely enough to support a property prediction and justify the next experiment.
Table of Contents
- When Bad Data Quietly Wastes Your Best Experiments
- Accuracy
- Completeness
- Consistency
- Timeliness
- Uniqueness
- Validity
- Lineage
- Provenance
When Bad Data Quietly Wastes Your Best Experiments
A formulation chemist runs a 96-well polymer screen. One composition produces an excellent viscosity profile and looks like the obvious candidate for scale-up. The team repeats the formulation at a larger volume, follows the recorded recipe, and watches the target property collapse.
The first investigation points toward chemistry. Perhaps mixing was insufficient. Perhaps the cure schedule changed. Perhaps the promising screening result was noise. A closer review finds two less dramatic problems. The parent viscosity value was recorded with the wrong unit, and the synthesis lot was linked to the previous day's batch rather than the material used in the well.
Neither defect necessarily makes the result look absurd. A value with a plausible number but the wrong unit can pass a casual review. A sample connected to a neighboring lot can still carry a complete-looking record. The dataset appears orderly while its scientific meaning has already weakened.
Practical rule: A materials record isn't trustworthy because every cell contains something. It is trustworthy when the value, unit, sample identity, method, and experimental context agree.
That distinction is the reason to measure more than completeness. A useful quality program combines accuracy, completeness, consistency, timeliness, uniqueness, validity, lineage, and provenance. These metrics describe different failure modes, and each answers a different question about whether a result can support a scientific conclusion.
The history of this discipline helps explain why that matters. The modern field is often traced to a 1996 paper by Richard Y. Wang and Diane M. Strong, which treated data quality as a multidimensional concept and identified 15 dimensions rather than reducing quality to one score. Many enterprise and government programs later adopted simpler six-dimension models, but the underlying lesson remains useful for laboratories: quality is fitness for a defined use, not an abstract grade. IBM's overview of data quality dimensions describes this movement from broad theory toward operational checks.
For a lab, instrumentation starts at capture. A balance, rheometer, DSC, or automated liquid handler should produce structured values with units, method versions, and instrument identifiers. Physical workflow matters too. Clear sample movement and labeling, supported by practical equipment such as the options described in this guide to find the right lab cart, can reduce the chance that containers, plates, and records become disconnected.
The rest of the framework is simple in principle. Define what each metric means, set a threshold that reflects the experiment's risk, assign an owner, and make a breach trigger a specific action. That turns silent data rot into a visible signal while there is still time to quarantine, correct, or repeat the work.
The Eight Metrics That Define a Trustworthy Dataset
A metric is useful only when its formula and reference rule are explicit. The European data quality guidelines distinguish quality dimensions from the quantitative measures used to assess them. In materials R&D, that distinction prevents a dashboard from presenting a number that nobody can interpret.
Accuracy
Accuracy asks whether a value reflects a property or event it claims to represent.
A practical formula is:
accurate records ÷ total checked records × 100
For thermal analysis, compare a measured DSC onset against a certified reference material or an approved laboratory standard. The comparison rule should define acceptable deviation, not merely whether the instrument returned a number. Accuracy can also involve a blind replicate, a reconciliation against a trusted calculation, or an independent measurement method.
Completeness
Completeness measures whether required information is present.
A simple formula is:
populated required fields ÷ total required fields × 100
For a cure study, required fields might include formulation composition, cure temperature, dwell time, atmosphere, specimen identifier, and modulus result. A record with a modulus value but no cure schedule may be numerically populated and scientifically incomplete. The field list must therefore be defined by the intended use, not by whatever columns happen to exist in the export.
Consistency
Consistency checks whether the same sample and attribute agree across systems or records.
One possible measure is:
matching cross-system values ÷ total cross-system comparisons × 100
Compare the sample composition and lot identifier in the ELN with the corresponding values in the LIMS. If one system lists a cure temperature in Celsius and another stores the same field in Fahrenheit without a clear conversion, the conflict is more than cosmetic. It can alter model features, experimental interpretation, and the instructions used for scale-up.
Timeliness
Timeliness measures whether data becomes available within the window required by the workflow.
For a batch process, calculate:
records available within the agreed window ÷ total expected records × 100
You can also track the lag directly as the current timestamp minus the latest measurement timestamp. A result that arrives after the formulation decision has already been made may be accurate, but it isn't timely for that decision. Real-time release, instrument scheduling, and active learning require different freshness expectations, so the window must be tied to the use case.
Uniqueness
Uniqueness identifies duplicate records that should represent one sample, run, or event.
A useful rule checks whether a composite key such as project, batch, sample, measurement, and replicate occurs only once where uniqueness is expected. Duplicate sample IDs are particularly dangerous in machine learning because the same material can appear to be separate observations. That can distort comparisons between training and evaluation data without producing an obvious database error.
Validity
Validity asks whether a value follows the permitted schema, unit, type, range, and business rules.
For concentration, a validation rule might require a numeric value, a declared unit, and membership in an approved unit set such as ppm or wt%. For viscosity, the system can reject text in a numeric field, flag values outside a physically credible range, and require the measurement temperature. Validity doesn't prove that a value is scientifically correct. It confirms that the value is expressed in a form the workflow can safely interpret.
Lineage
Lineage traces a result through its relationships. A modulus result should lead to the specimen, formulation, parent synthesis lot, processing step, and underlying raw file.
Measure lineage as the share of result records that resolve through all required parent links. A high-quality lineage graph lets a scientist answer, “Which synthesis and processing history produced this property?” without reconstructing the path from emails and filenames.
Provenance
Provenance records how a value came into existence. Capture the operator or automated process, instrument identifier, method version, timestamp, and relevant acquisition settings.
Lineage tells you where the record connects. Provenance tells you how the measurement was produced. Two results can point to the same sample while differing in instrument calibration, method version, or operator entry. Without provenance, a later reviewer can't separate a chemistry effect from a measurement-process effect.
These metrics shouldn't be collapsed into one universal score too early. A dataset can be complete but invalid, accurate in aggregate but poorly traceable, or timely but inconsistent across systems. The interpretation comes from the dimension, formula, reference rule, and scientific purpose together.
Thresholds and Sampling Methods for Materials Data
Thresholds should reflect consequence. A missing note may be tolerable in exploratory work, while a missing parent lot or unit can make a result unusable for scale-up. The WHO Data Quality Review framework describes a benchmark as the desired or acceptable level and a cut-off as a signal that records or units need examination. That distinction works well in a laboratory because a threshold should trigger a decision, not merely decorate a dashboard.
The following starting points are intentionally explicit. A lab should calibrate them against method precision, risk, and the intended model or process decision.
Data Quality Metric Thresholds for Materials R&D
| Metric | Acceptable Threshold | Sampling or Instrumentation Method |
|---|---|---|
| Accuracy | Target 99% of values within 2% of a reference standard for the selected critical measurements | Insert blind replicate references every twentieth run and compare automatically |
| Completeness | 95% of critical fields populated when the dataset closes | Run automated nightly audits against required fields such as cure temperature, dwell time, and modulus |
| Consistency | Zero unresolved conflicts between ELN and LIMS after 24 hours | Reconcile shared sample, lot, composition, and method fields on each synchronization |
| Timeliness | 90% of records available within four hours of measurement | Track measurement timestamp to queryable-record timestamp for every instrument feed |
| Uniqueness | Zero duplicate composite IDs across active lots | Enforce compound keys at ingestion and scan historical records for collisions |
| Validity | 100% pass on unit and range checks at entry | Apply schema validation, approved-unit lists, and domain rules before acceptance |
| Lineage | 100% traceability from result to parent synthesis and raw file | Require parent identifiers and raw-file links before a result enters the model-ready dataset |
| Provenance | 100% capture of operator, instrument ID, and method version at capture | Populate metadata automatically from instrument and ELN context rather than relying on free text |
The table isn't a universal certification standard. It is a practical control design. For high-risk transactional or PII fields, WHO's framework gives an example of setting an accuracy reconciliation target at ≥99%, which illustrates why critical fields can need stricter treatment than low-impact annotations.
Sampling also deserves care. Blind references test measurement accuracy, nightly audits catch missing fields after ingestion, and entry-time validation prevents known format defects from moving downstream. A small dataset can make a percentage unstable, so review the underlying records and the reason for each breach rather than tuning a threshold to produce a pleasing score.
Monitoring, Alerting, and Governance as a Continuous Loop
A quality metric earns its place when it changes behavior. The operating loop has four parts: instrument the check, publish the result, route the exception, and write the correction back into the source workflow.
Start in the data backbone, whether that is a LIMS export, a structured ELN feed, or a Polymerize-anchored lab data lake. Calculate metrics at the dataset, batch, instrument, and project levels where the comparison is meaningful. A single portfolio average can hide the fact that one rheometer or one formulation campaign is producing the majority of failures.
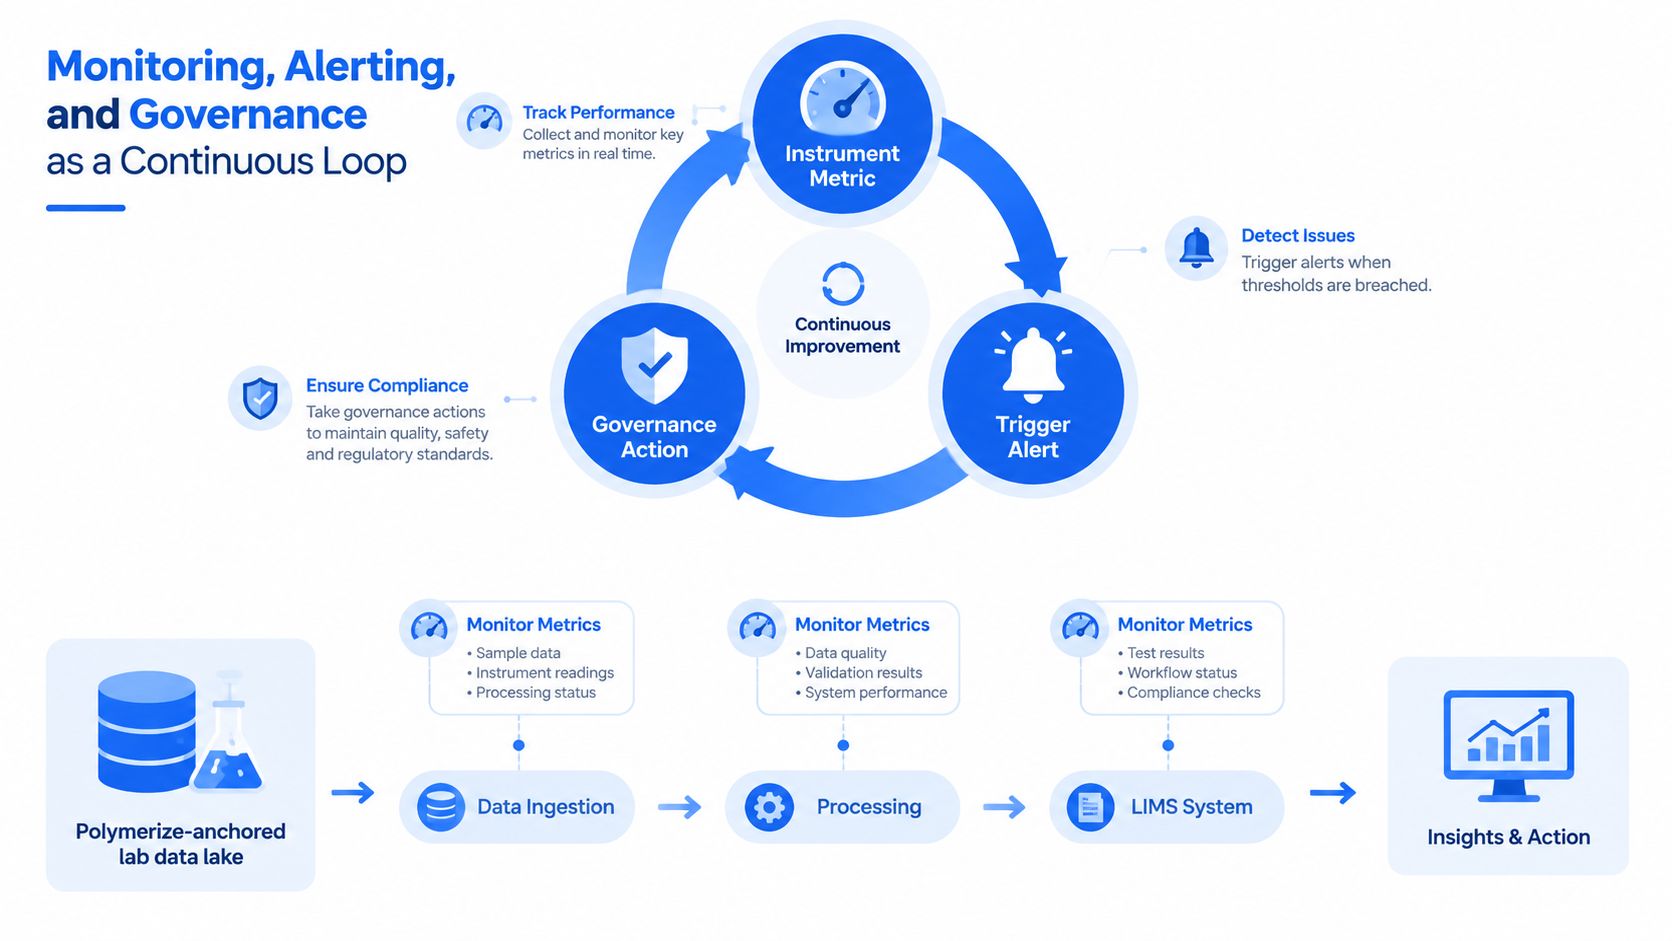
Route each breach to a named owner
Ownership should follow the source of the defect, not the team that first notices it.
- Lab analyst: Owns accuracy review and provenance capture for measurements and manual entries.
- Instrument engineer: Owns timeliness failures, connectivity gaps, and signs of sensor drift.
- Informatics lead: Owns cross-system consistency, identifier design, and lineage across projects.
- Project scientist: Decides whether a suspect result can remain in an exploratory analysis or must be quarantined.
A useful scorecard includes the metric, observed value, threshold, affected records, owner, due date, and remediation status. Alerts should go to the team's established ticketing or messaging channel, but notification alone isn't governance. The recipient needs a playbook.
For a failed accuracy check, quarantine the affected batch and re-run the measurement against the reference. For a validity failure, reject the entry or request a corrected unit. For a lineage break, hold the record out of model training until the parent synthesis and raw file are linked. For a consistency conflict, identify the authoritative source and record the reconciliation rather than overwriting one system.
A threshold without a response path is only a decorative number.
Tie each control to a service-level indicator and service-level objective. For example, the indicator might be the share of records arriving within the agreed freshness window, while the objective defines the acceptable level for the relevant pipeline. Review breaches weekly with the analysts, instrument team, informatics owner, and project scientists. The correction should flow back into the ELN template or structured capture form so the same defect becomes harder to reintroduce.
Maintenance teams use a similar principle when they optimize CMMS with PdM, connecting an observed condition to an owner and a preventive action. In the lab, the action may be a remeasurement or metadata correction rather than equipment maintenance, but the control loop is comparable.
For a short explanation of how monitoring workflows can be organized, use this video as a supplementary visual reference.
Governance isn't a quarterly audit. It's a weekly ritual where the dashboard, the owners, and the remediation playbooks meet.
From Data Quality to Model Confidence and Next Experiment
A clean dataset doesn't automatically produce a reliable model. It gives the model a defensible basis for learning, and it gives scientists evidence for deciding which predictions deserve experimental attention.
Consider a training batch with a completeness score below 0.9. That score should not be treated as a universal failure line, but it is a useful signal that confidence in predictions may need to be reduced, especially when missing fields are scientifically important. The model can expose that uncertainty, exclude the affected feature, or route the records for review. The right response depends on whether the missingness is random, systematic, or concentrated in a particular chemistry family.
Validity failures require a different treatment. A viscosity value outside a physically credible domain may indicate a real unusual material, but it may also indicate a unit error or transcription defect. Instead of allowing the row to influence training normally, the pipeline can flag it for inspection and, where appropriate, down-weight it in the loss function until a scientist confirms its meaning.
How Data Quality Metrics Feed Model Confidence and Experiment Planning
| Data Quality Metric | Downstream Model Effect | Experiment Planning Action |
|---|---|---|
| Completeness | Missing composition or process features increase uncertainty or reduce usable training context | Recover the field, restrict the prediction, or prioritize an experiment that fills the gap |
| Accuracy | A disagreement with a reference can distort the learned property relationship | Recheck the measurement before treating the candidate as a hit |
| Consistency | Conflicting ELN and LIMS values create ambiguous feature representations | Resolve the authoritative value and prevent the record from entering training prematurely |
| Timeliness | Stale process or test data can misrepresent the current operating window | Refresh the measurement when the decision depends on present conditions |
| Uniqueness | Duplicates can make a material appear more strongly supported than it is | Deduplicate before splitting data or selecting the next candidate |
| Validity | Unit, schema, or range failures can inject nonphysical values | Quarantine, convert with a documented rule, or repeat the measurement |
| Lineage | Missing parent synthesis links block interpretation of causal chemistry | Do not trust the prediction for scale-up until the route is restored |
| Provenance | Unknown method or instrument context weakens reproducibility and comparability | Confirm the cure schedule or method before ranking the candidate highly |
A candidate polymer can score well on completeness while still having poor provenance. Its composition, modulus, and cure result may all be present, but the cure schedule could be missing from the method record. In that situation, I would move the candidate down the priority list until the chemist confirms the schedule. The dataset is populated, yet the experimental meaning remains uncertain.
Materials-specific review supports this stricter interpretation. A recent review in materials science emphasizes schema, column, and population completeness, along with missing-data ratios, while also arguing for a sustainable, high-quality materials data ecosystem rather than one generic metric set. It also highlights representativeness and reliability, including geographical, temporal, and technological correlation, generation method, and validity. The review in National Science Review reflects the question scientists ask: is this dataset fit to support a prediction or experiment?
A materials informatics platform can surface record-level and batch-level quality flags, but the scientist still needs to understand why a flag exists. The strongest active-learning loop therefore ranks candidates using both predicted performance and data trust. A high predicted property with weak lineage is not equivalent to a high predicted property supported by reproducible synthesis and measurement context.
Data quality is the silent prior on every model the lab ships. If the prior is weak, a confident prediction can still be a poor reason to consume material, instrument time, and scale-up capacity.
Which Metrics to Instrument First and Why
Resource-constrained labs shouldn't begin by trying to perfect every field. The first controls should target defects that can invalidate an entire campaign or corrupt the learning loop.
I recommend starting with completeness on primary measurement fields, uniqueness across sample identifiers, and provenance on synthesis conditions. These three metrics cover the most expensive forms of ambiguity: a missing feature that prevents meaningful comparison, a duplicate that makes the dataset appear larger or more consistent than it is, and a result nobody can reproduce.
Start where the cost of error is highest
A missing composition column can make a formulation result unusable for modeling. A duplicate sample ID can place the same physical material into apparently separate records. Missing cure temperature, mixing order, or method version can prevent a successful result from being repeated.
That doesn't mean accuracy is unimportant. It means early accuracy work should focus on structured numeric outputs and reference comparisons, not on achieving perfect interpretation of every free-text note. Parse and validate the viscosity, modulus, thermal transition, concentration, and temperature fields first. Free-text observations can remain searchable and reviewable while the team builds better controlled vocabularies.
A useful first sprint protects the decisions that consume the most material and instrument time.
Choose one dataset family, such as thermal analysis runs, and prove the loop there. Define required fields, enforce identifier uniqueness, capture instrument and method metadata, publish a scorecard, and assign a named steward for every metric. Once analysts can resolve breaches without creating a second manual process, expand to rheology, mechanical testing, or formulation recipes.
The wider industry context supports this selective approach. The Precisely 2025 planning insights reports that 64% of organizations cite data quality as their top data integrity challenge, 77% rate their data quality as average at best, and 49% say inadequate automation tools block progress. The same source reports that only 17% have a formal process for measuring and reporting data quality metrics, 14% have automated data quality management, and 11% have end-to-end pipeline observability. Those figures point to an operational gap, not a need for another elaborate dashboard.
Metrics without owners are theatre. Your first instrumentation sprint should end with a steward, a threshold, an alert route, and a documented response for each chosen metric.
A Practical Rollout Plan and What to Watch Out For
A lab can begin on Monday without redesigning its entire information architecture. The sequence matters more than the number of controls deployed at once.
Put the control loop in place gradually
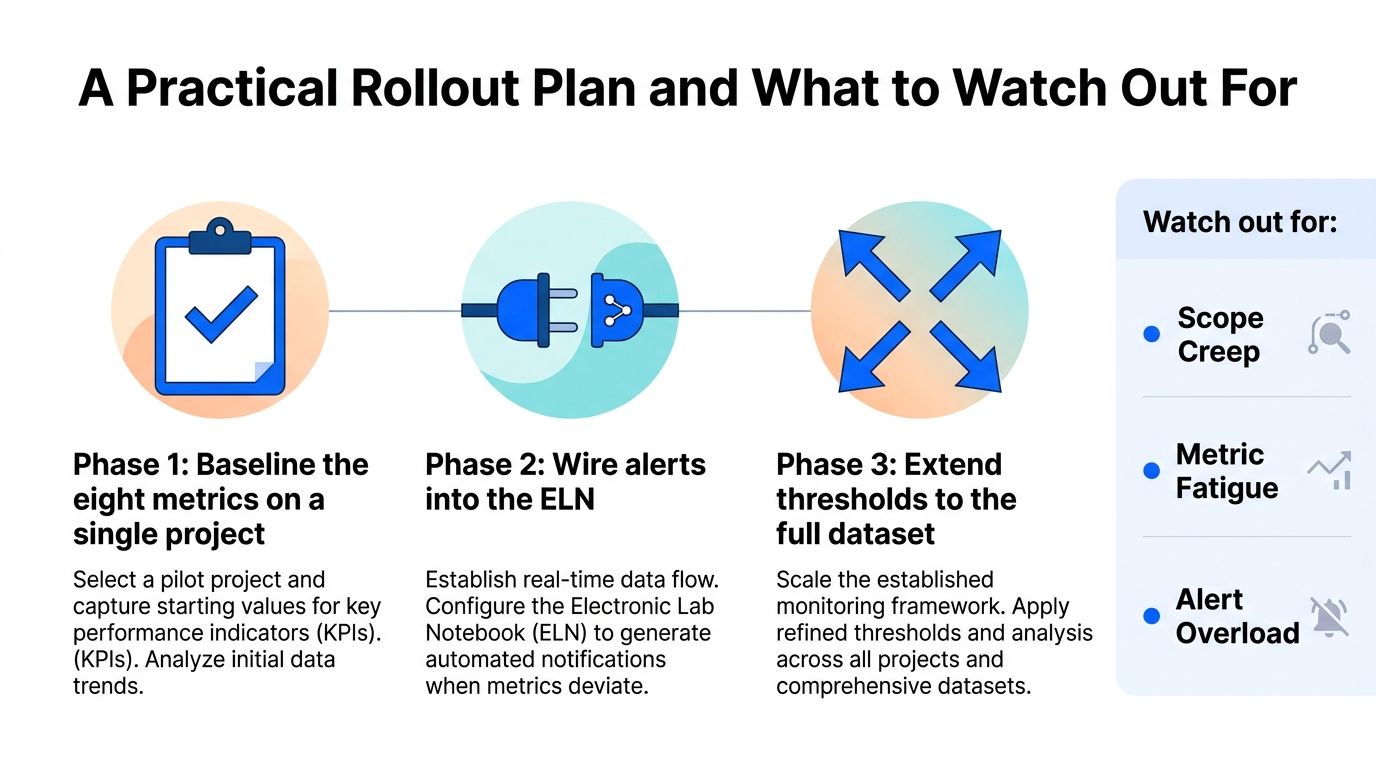
Phase one, baseline one project. Profile the eight metrics on a single dataset family. Record the affected samples, not only the aggregate values, and identify which defects originate at the bench, instrument, ELN, LIMS, or transformation layer.
Phase two, connect alerts to capture. Wire threshold breaches into the ELN or the team's existing ticketing workflow. Make the alert actionable, with a record link, owner, reason, and response path. Update the structured template when a recurring defect comes from manual entry.
Phase three, extend across the portfolio. Apply the tested rules to additional projects and instruments. Keep domain-specific thresholds where methods differ, and separate exploratory data from records approved for model training or scale-up decisions.
Phase four, connect quality to model use. Pass quality flags into model training, prediction display, and experiment planning. A candidate with weak provenance should carry a visible limitation rather than appearing equivalent to a fully traceable candidate.
Watch for attractive but unhelpful progress
Don't tune thresholds around a tiny dataset because the resulting chart looks stable. Don't postpone provenance until an audit, because reconstruction is hardest after the scientist, instrument configuration, or method has changed. Don't treat completeness as a vanity KPI. A fully populated record can still carry the wrong unit, wrong lot, or wrong method.
Change management also needs respect. Bench scientists won't consistently enter lineage fields if the form is slow, ambiguous, or disconnected from their actual work. Capture identifiers automatically where possible, use controlled values for units and methods, and explain which downstream decision depends on each field.
Skip advanced anomaly detection, portfolio-wide scoring, and elaborate model-readiness labels until the basic checks are stable. Success will show up in practical outcomes: fewer failed replicates, cleaner training sets, and faster decisions about which formulation deserves the next experiment.
Polymerize helps materials R&D teams unify experimental data from spreadsheets, ELNs, and other silos into a structured foundation where quality checks, traceability, and model-readiness signals can support AI-guided experimentation. Visit Polymerize to see how the platform can connect data quality metrics with property prediction and next-experiment planning.
Put your R&D data to work
See how materials teams use Polymerize to plan fewer experiments and reach target properties faster.