



Your first harmonization project usually starts the same way. One lab notebook says the polyurethane resin is the same, the hardener ratio is the same, and the test method is the same, but the Brookfield readout in one site is visibly higher, the DSC cure shifts, and everyone starts asking whether the formulation drifted or the lab did. That's the point where batch effect correction stops sounding like an omics term and starts looking like a Monday morning problem, with reruns, rejected transfers, and model retraining waiting behind it.
The useful way to think about it is simple. First, find where the drift is coming from. Second, choose a correction method that fits the size and structure of your materials dataset. Third, check that the cleaned data still behaves like your material, not just like a tidy spreadsheet.
Table of Contents
- Start with structured metadata
- Build a design that can be corrected
- Normalize before you correct
- Correct, then test the correction
- Validate on held-out samples
- A Python pattern for ComBat-style harmonization
- An R pattern for ComBat, MNN, and Harmony
- QC checks that should follow every run
When the Same Formula Gives Different Results
A formulation chemist knows this pattern immediately. A polyurethane resin with the same hardener ratio can measure 3,200 mPa·s on a Brookfield in Singapore and 4,100 mPa·s in Stuttgart, then show a cure profile shift that makes the downstream DSC look like a different system. The formula on paper did not change, but the measured response did, because the measurement context changed with it.
That gap between nominal composition and observed response is where batch effects live. In materials R&D, the “batch” may be a test campaign, a site, an operator, an instrument, a software version, or a raw-material lot. The signal you care about, viscosity, modulus, Tg, cure peak shape, can get pushed around by the measurement environment even when the formulation intent stays fixed.
Why this becomes a workflow problem fast
Once the drift shows up, the team starts paying for it in small, expensive ways. A transfer gets rejected because the viscosity window looks off. A model gets retrained because one campaign no longer sits with the rest. A scientist reruns samples that should have been comparable on day one.
That friction is exactly why batch effect correction matters in materials work. It gives you a way to separate the variation you intended to create from the variation introduced by the way you measured it, but only if the experiment was designed well enough to make that separation possible.
Practical rule: if two campaigns are supposed to answer the same question, they need enough shared reference material, shared metadata, and shared test logic to let you compare them honestly.
The rest of this guide treats the problem the way a senior materials informatics scientist would. Not as a software feature, but as a sequence of design decisions, correction choices, and validation checks that keep a formulation dataset useful after it crosses sites, instruments, and time.
What Batch Effects Are and Where They Hide in Materials Labs
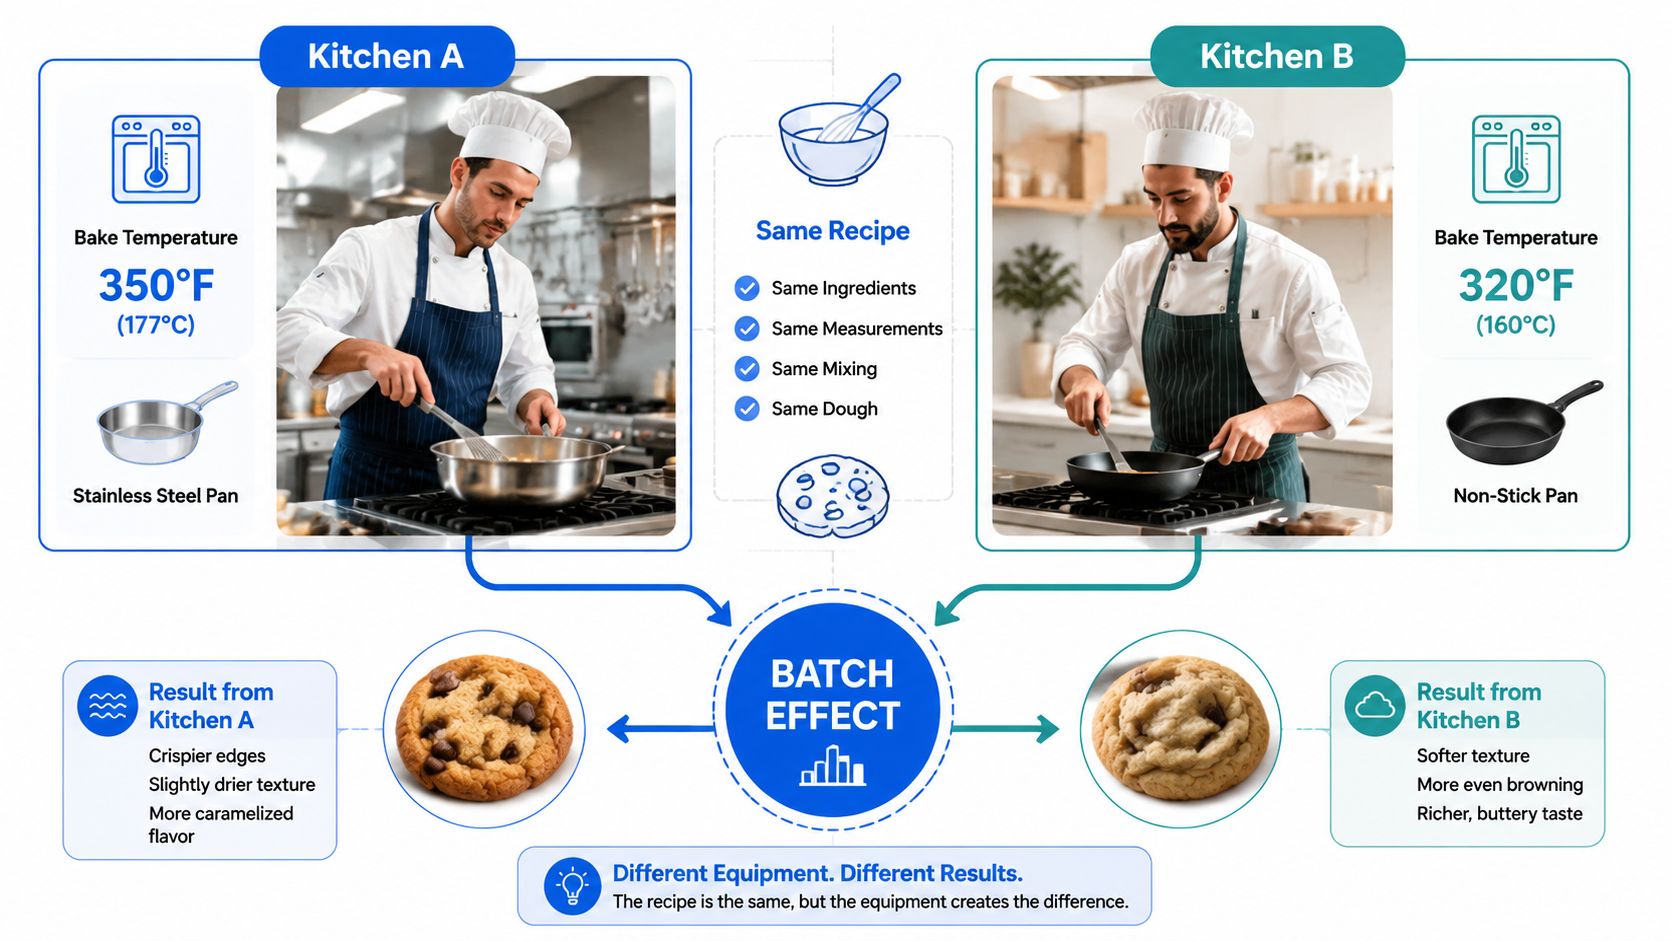
A batch effect is any shift in measured response caused by something other than the formulation variable you intended to change. The cleanest analogy is two kitchens baking the same cookie recipe with different ovens and ambient humidity. Same ingredients, different outcome, because the environment changed.
The common sources in a materials lab
In practice, the drift usually comes from places people already suspect, but don't always record well enough. Instrument calibration drift between rheometers, DMAs, DSCs, or GPC systems can shift the same sample in a consistent direction. Raw-material lot-to-lot variation can do the same, especially when monomers, fillers, catalysts, or pigments are involved.
Operator and protocol differences matter too. A sample that aged for one hour before testing in one site and overnight in another is not really the same sample from a measurement standpoint. Environmental covariates, including room temperature and humidity, can move soft materials, reactive systems, and moisture-sensitive formulations in ways that look like composition effects if you don't track them.
Software is part of the story as well. A change in DSC baseline handling or GPC analysis settings can create a batch signature even when the physical instrument stayed the same. That's why averaging batches together, or just adding lot as a categorical predictor without inspecting the design, usually misses the point. It can hide interactions and inflate variance downstream.
Why metadata comes first
The first usable record is not the property value. It's the metadata around the property value. If you do not know which instrument ran the test, which operator prepared the sample, which lot supplied the resin, and which ambient conditions surrounded the run, correction has nothing to work with.
Design-first rule: capture metadata before you generate numbers, because correction can't recover information that was never recorded.
That rule is the same one that shows up across reproducible omics work, where batch adjustment started as a formal statistical problem and matured into a workflow discipline. In materials R&D, the vocabulary is different, but the logic is identical.
The Main Correction Methods Explained Side by Side
Batch correction methods differ less in branding than in the kind of distortion they assume. Some shift values directly. Some align similar samples across batches. Others work in a lower-dimensional embedding. The newest methods learn a latent representation that tries to keep formulation signal while absorbing technical drift.
Location-scale methods
These are the most direct tools. ComBat and related approaches estimate batch-specific shifts in mean and spread, then shrink those estimates toward a shared prior. That helps when the dataset is small or uneven. The empirical Bayes logic behind ComBat became a standard template after the 2007 microarray paper, and later reviews still place it alongside limma's removeBatchEffect as a core supervised batch-correction method (Bioinformatics review on ComBat and related methods).
Use this family when batch is a nuisance factor, the batches are reasonably populated, and you need a corrected matrix for downstream modeling. The trade-off is simple. These methods work best when the problem is a systematic offset, not a nonlinear distortion or a batch-specific change in variance shape.
Matching-based methods
Methods like MNN Correct line up samples that look similar across batches and use those matches to estimate the shift. They work best when the batches overlap in composition space, so there are comparable formulations or states in each run. For materials work, that usually means the same reference formulations were repeated across sites or instruments.
This family is intuitive, but it depends on shared structure. If one batch sits at one end of the formulation space and the other batch sits at the other end, matching becomes fragile quickly. It can still help, but only if the overlap is real and the nearest neighbors are comparable.
Embedding-based methods
Tools such as Harmony and BBKNN work on a lower-dimensional representation instead of the raw matrix. Harmony iteratively adjusts the embedding so batches mix more evenly while trying to preserve the underlying structure. That makes it useful for iterative R&D programs where new batches arrive while the project is still active.
These methods are often easier to inspect than a full matrix correction, because you can see whether the embedding still separates meaningful formulation groups after alignment. The catch is that the output depends on the embedding quality. If the low-dimensional map is poor, the correction will inherit that weakness.
Variational and deep models
Deep methods, including VAE-based approaches, learn a shared latent space and can handle nonlinear drift better than simple linear correction. They are attractive when materials data is messy, high-dimensional, and shaped by several technical factors at once. The trade-off is validation. These models are harder to inspect, and overcorrection is easier to miss.
The main point is that the best method depends on the downstream task. A method that improves clustering can hurt classification. A method that makes visualization cleaner can distort property prediction. In harmonization work, the goal is not the prettiest plot. It is a correction that leaves the chemistry you care about intact.
| Batch correction methods at a glance | ||||
|---|---|---|---|---|
| Method family | Representative tools | Best for | Key assumption | Main limitation |
| Location-scale methods | ComBat, removeBatchEffect | Small to medium datasets with clear batch nuisance | Batch acts like a systematic shift | Can struggle with nonlinear drift |
| Matching-based methods | MNN Correct | Shared reference states across batches | Similar samples exist in every batch | Needs overlap in composition space |
| Embedding-based methods | Harmony, BBKNN | Iterative projects with new batches arriving | Low-dimensional structure is meaningful | Output depends on embedding quality |
| Variational and deep models | VAE-style methods | Complex nonlinear technical drift | Latent space can separate signal from noise | Validation is harder and overcorrection risk is real |
Practical rule: choose the method that matches your downstream decision, not the method with the cleanest-looking plot.
A Practical Workflow from Metadata to Validation
A reliable harmonization project works like a gated process. You do not skip ahead because the data looks “good enough.” You move through each checkpoint in order, and each one exists to answer a different question about whether the dataset is safe to trust.
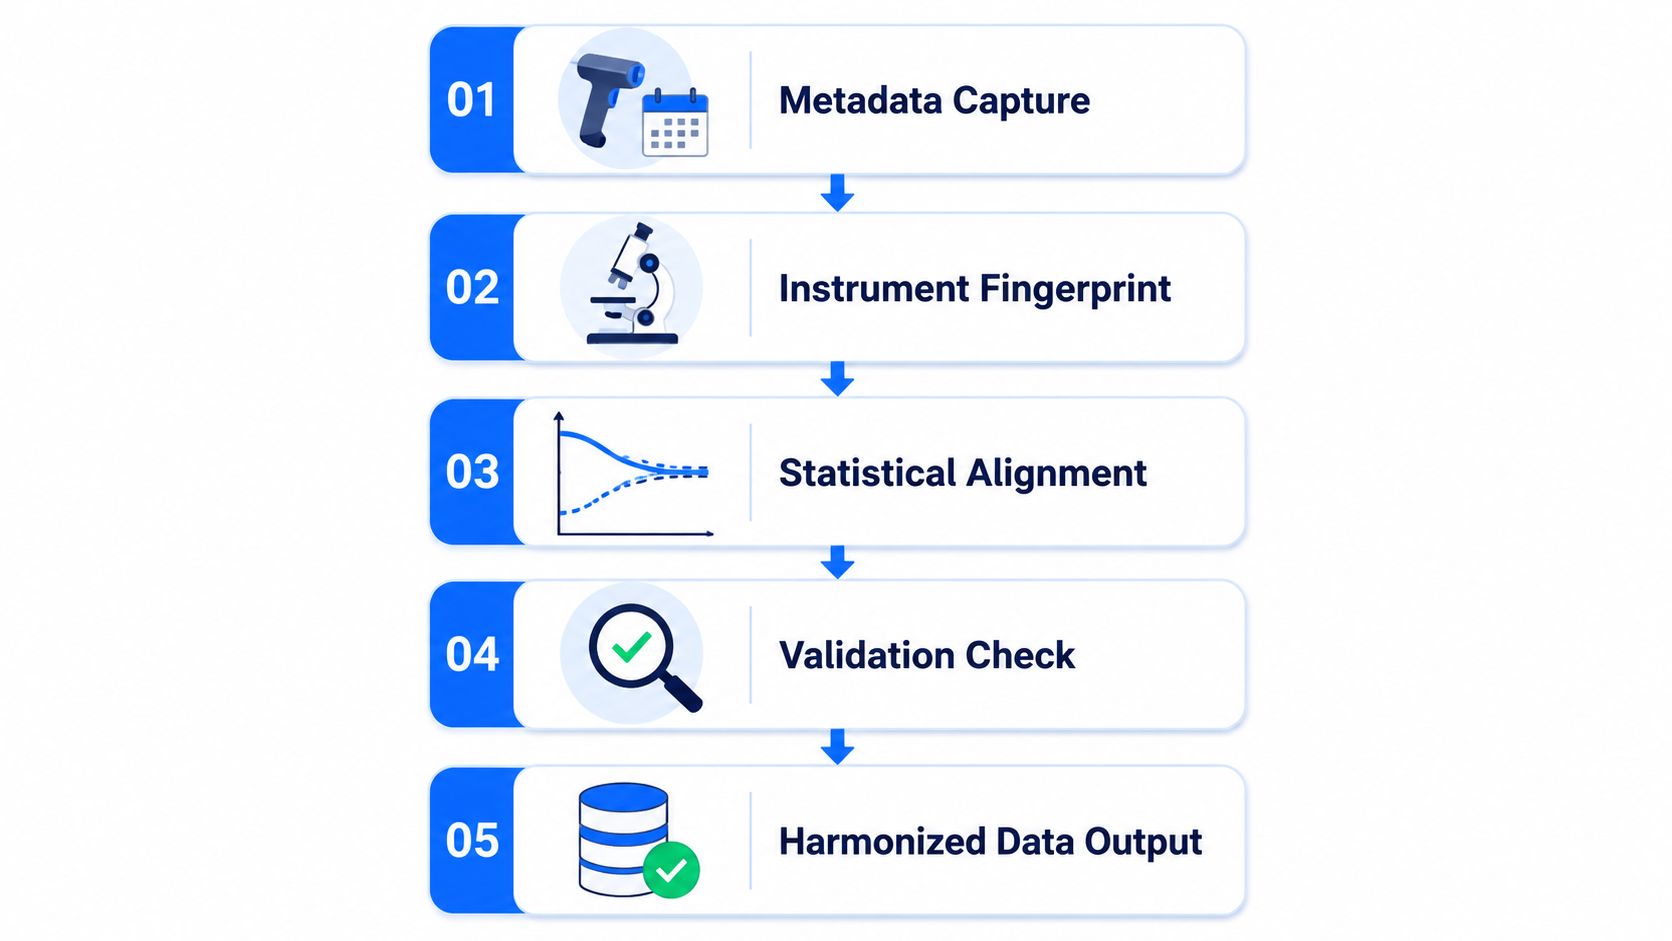
Start with structured metadata
Record instrument ID, calibration date, lot numbers, operator, ambient temperature, humidity if relevant, and sample geometry before the first measurement gets logged. If those fields live in free text, they're already harder to use. If they're in a structured template, they become usable covariates instead of a scavenger hunt.
Build a design that can be corrected
The best batch correction still needs overlap. At least one shared reference sample in every batch gives you something to anchor against, which is the same logic used in reference-panel designs in omics. In materials terms, that might be a standard resin, a control filler system, or a benchmark formulation that every site runs the same way.
Normalize before you correct
Normalization removes known technical offsets first, things like unit conversion, blank subtraction, or per-instrument scaling. That step matters because you want the correction algorithm to spend its effort on the residual batch structure, not on avoidable bookkeeping noise.
Correct, then test the correction
After correction, check whether the reference samples still sit where they should. If a known spike-in or control material has drifted away from its expected behavior, the correction is too aggressive or the design is too weak. This is the stage where a lot of teams confuse a prettier plot with a better dataset.
Validate on held-out samples
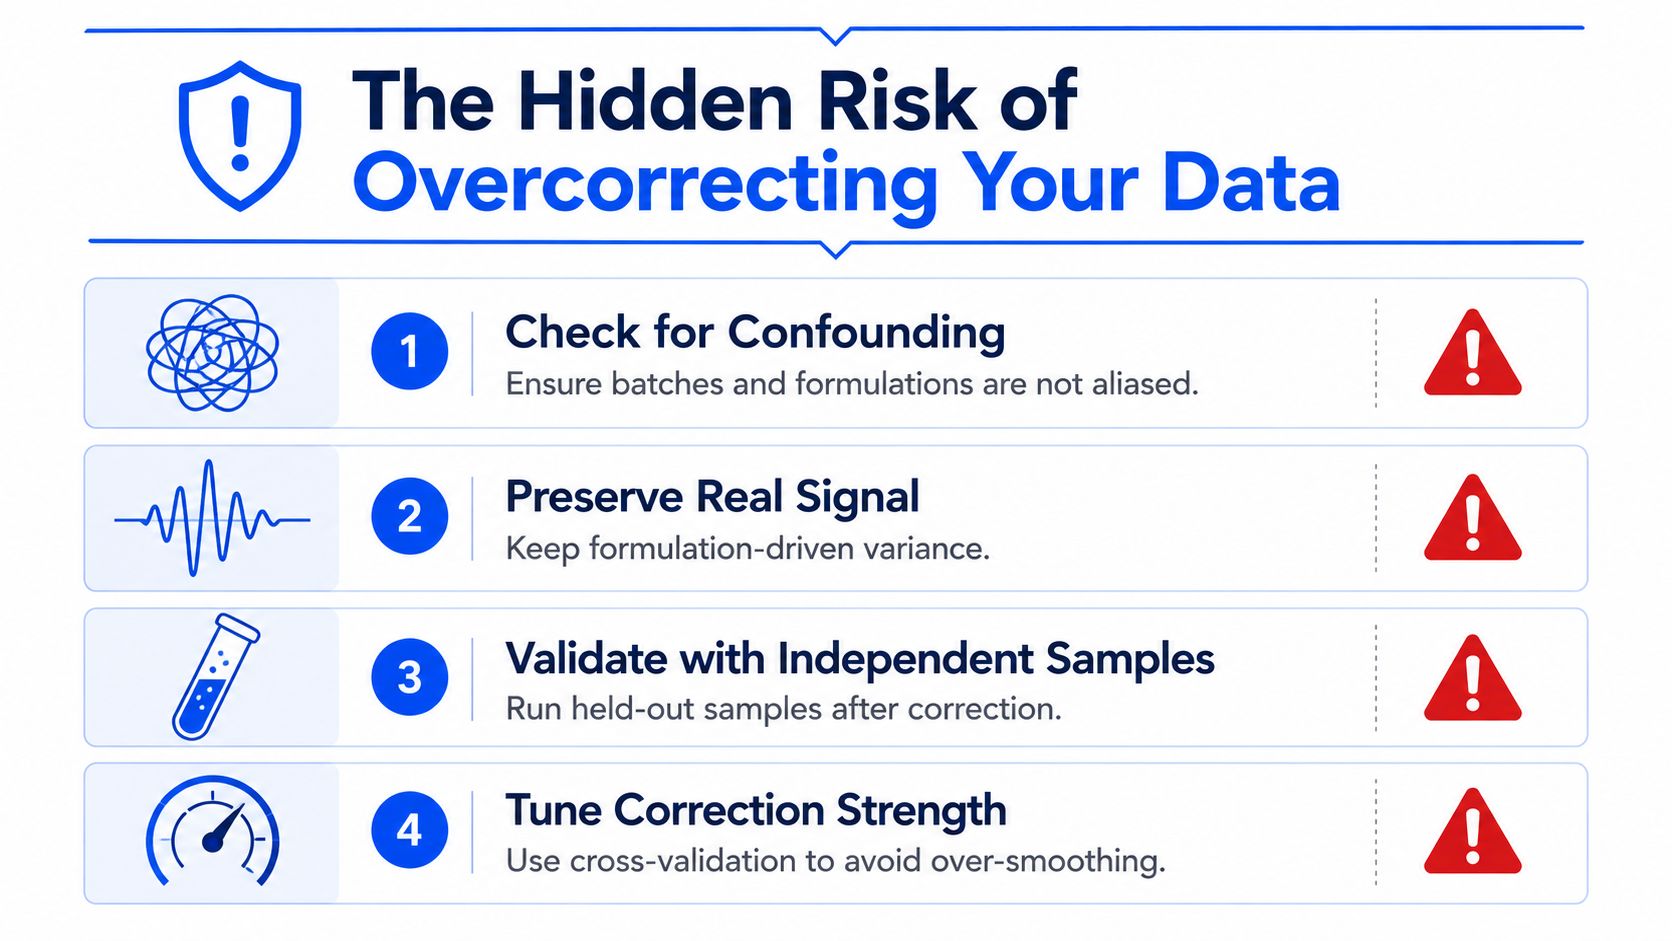
Use held-out controls, replicate concordance, and principal-variate or PCA-style checks to see whether batch clustering has dropped. The 2024/2026 benchmarking literature in omics keeps making the same point, correction is not just about removing batch structure, it's about preserving the right signal while doing so (multi-omics review and applied examples).
If metadata capture was weak, no amount of downstream cleaning will make the analysis trustworthy.
Code Recipes and QC Checks You Can Run Today
The fastest way to learn these methods is to run one on a tidy dataset and inspect the before-and-after structure. For a materials-style table, think columns like viscosity, tensile_modulus, batch, and formulation, then check whether the corrected output still respects known controls.
A Python pattern for ComBat-style harmonization
import pandas as pdfrom sklearn.decomposition import PCAimport matplotlib.pyplot as plt# tidy dataframe columns: viscosity, tensile_modulus, batch, formulation# df = pd.read_csv("materials_data.csv")features = ["viscosity", "tensile_modulus"]X = df[features].copy()# Example placeholder for a harmonization library that supports ComBat-style adjustment# corrected = combat_harmonize(# data=X,# batch=df["batch"],# covariates=df[["formulation"]]# )# For QC, compare PCA before and afterpca = PCA(n_components=2)coords_before = pca.fit_transform(X)# coords_after = pca.fit_transform(corrected)plt.scatter(coords_before[:, 0], coords_before[:, 1], c=df["batch"].astype("category").cat.codes)plt.title("Before correction")plt.show()An R pattern for ComBat, MNN, and Harmony
library(sva)library(batchelor)library(harmony)expr <- as.matrix(df[, c("viscosity", "tensile_modulus")])# ComBatcombat_out <- ComBat(dat = expr, batch = df$batch, mod = model.matrix(~ formulation, data = df))# MNN-style correction# Assume a SingleCellExperiment or similar object in a materials-adapted workflow# mnn_out <- fastMNN(sample1, sample2)# Harmony on a low-dimensional embedding# harmony_out <- HarmonyMatrix(expr, meta_data = df, vars_use = "batch")The exact function names vary by package and data structure, but the workflow does not. You give the method the batch label, preserve the formulation variable, then inspect whether the output still behaves like chemistry rather than bookkeeping.
QC checks that should follow every run
- Batch mixing score. Use a kBET- or iLISI-style check to see whether samples from different batches mix within the same formulation class.
- Reference preservation. A known spike-in or benchmark material should stay within its expected tolerance, ideally around the same scale you used before correction.
- Cluster separation. Silhouette width on formulation clusters should remain positive if those clusters are real.
- Residual structure. Batch-cluster silhouette should drop, but residual variance should not inflate so much that you create noise in a new form.
| Method | Required Inputs | Key QC Output |
|---|---|---|
| ComBat | Batch labels, feature matrix, optional formulation covariate | Corrected matrix with preserved reference behavior |
| MNN | Shared or overlapping samples across batches | Matched embedding or corrected values that reflect cross-batch alignment |
| Harmony | Low-dimensional embedding, batch labels, metadata | Batch-mixed embedding with retained formulation structure |
The Hidden Risk of Overcorrecting Your Data
The hardest part of batch effect correction is not removing too little. It is removing the signal you need to keep. Recent benchmarking work on correction methods groups outcomes into four clear cases, the batch artifact is removed, partly retained, the signal is removed by mistake, or new artificial structure is created. That framing helps teams see failure modes as practical risks, not abstract method debate (review and benchmarking discussion).
Where overcorrection shows up in materials data
A common failure looks harmless at first. One lab tests high-MFI grades, another tests low-MFI grades. If you run Harmony or another strong alignment method without preserving grade class, the algorithm can pull away a meaningful formulation difference because it sees batch variation and grade variation tangled together. The corrected view looks cleaner, but the chemistry has been flattened.
That is why the question is not whether a method reduces batch separation. The question is whether it reduces batch separation without erasing the formulation structure you care about. The correction literature makes the same point in omics settings, many methods are calibrated too aggressively, and the correction step itself can introduce measurable artifacts (reference-informed caution on overcorrection).
A short artifact-check checklist
- Check confounding: confirm that batch and formulation are not aliased in your design.
- Compare controls before and after: if a known reference moves too far, the correction is too aggressive.
- Re-fit a model with batch included: if batch still matters in the corrected data, the artifact was not fully removed.
- Shuffle batch labels once in a while: if the method behaves the same after permutation, it may be smoothing away real structure instead of correcting it.
Clean-looking plots do not prove clean science. They only show that the algorithm converged.
Centralizing Correction in an AI Native R&D Platform
Spreadsheet-based harmonization usually breaks at provenance. One person runs a correction, another exports a cleaned file, a third modifies the formulas, and nobody can tell which adjustment produced which result six weeks later. That is exactly the kind of drift an AI-native platform is meant to prevent.
Why centralization changes the workflow
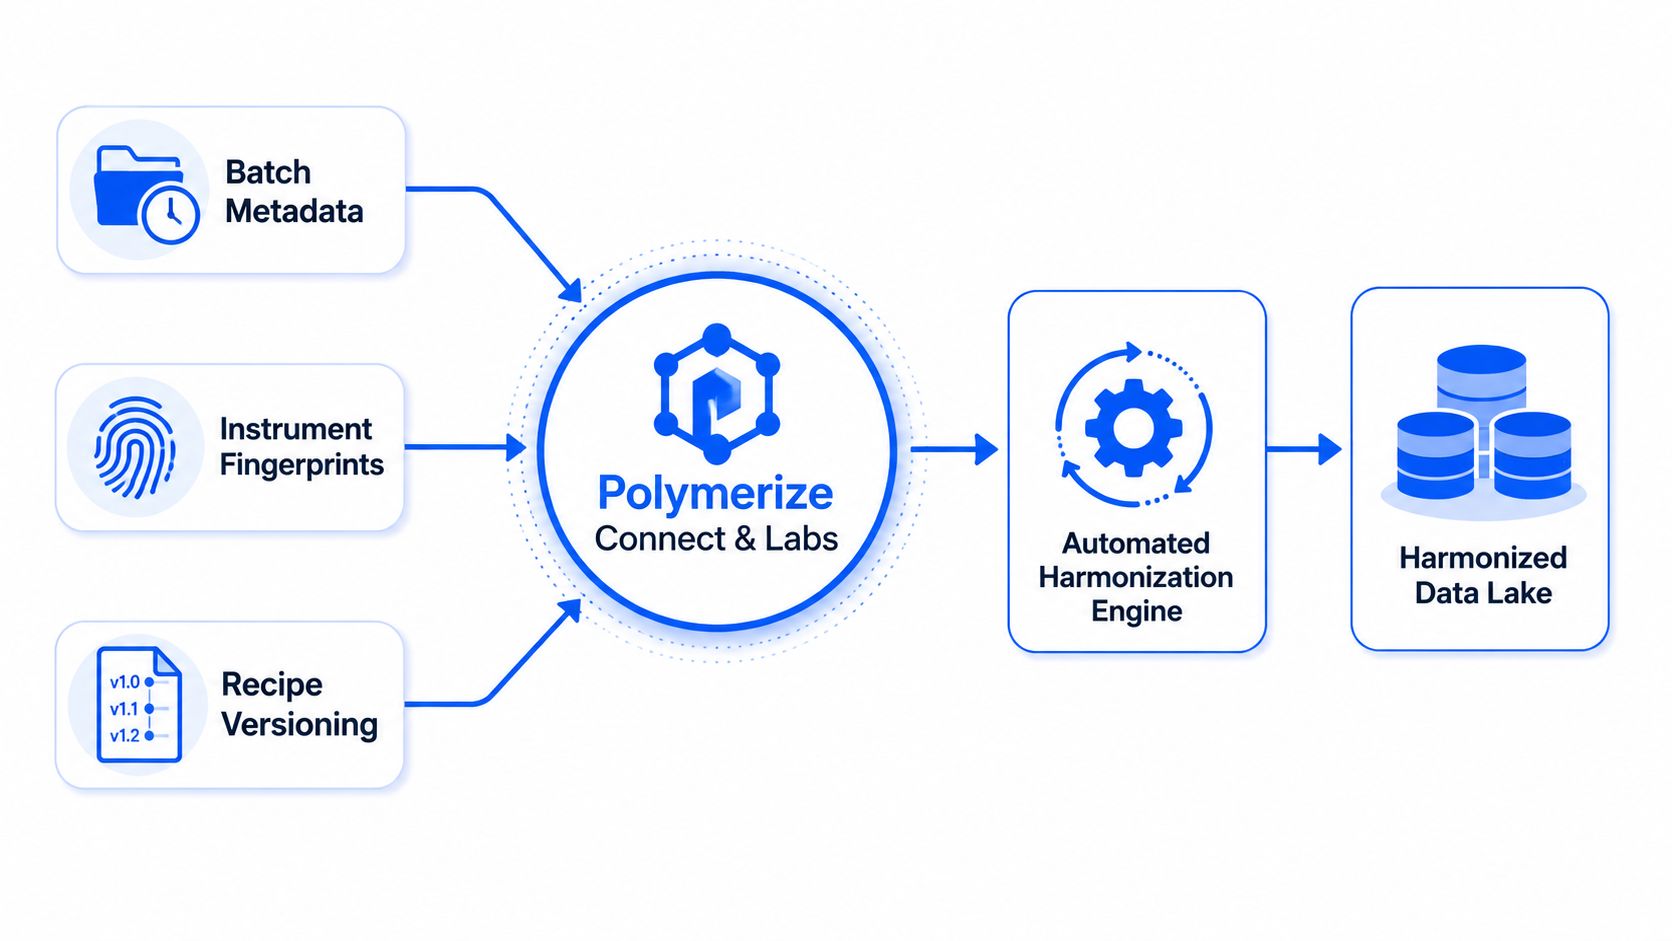
When batch metadata, instrument fingerprints, and recipe versioning live in one source of truth, harmonization can run against a consistent record every time new data lands. That makes correction reproducible instead of heroic. It also means suspect runs can be flagged before they feed downstream property models, which is a better place to catch a problem than after a dashboard already looks polished.
Polymerize Connect and Labs are built around that idea, a centralized data backbone plus model-aware analysis, so harmonization is not a one-off cleanup step. It becomes part of the ingestion flow, with covariates attached to the data from the start and correction logic applied consistently across teams and campaigns.
What to do this week
- Audit metadata fields: confirm that instrument ID, operator ID, lot number, and test date are being captured the same way everywhere.
- Standardize labels: stop mixing free-text names for the same instrument or material class.
- Enable auto-ingest: reduce the number of manual exports where provenance gets lost.
- Run a baseline pass: compare a standard ComBat-style harmonization on the last quarter of screening data so you can quantify drift before scaling to a larger campaign.
A centralized workflow won't fix a flawed experiment, but it will make the flaw visible sooner and the correction far more reproducible. That's the core win for materials teams that are tired of heroic cleanup cycles.
If you want batch correction to become part of a repeatable materials R&D workflow instead of a one-off rescue job, visit Polymerize. Polymerize helps teams centralize metadata, harmonize data reproducibly, and keep formulation signal visible while technical drift gets handled in a disciplined way.
Put your R&D data to work
See how materials teams use Polymerize to plan fewer experiments and reach target properties faster.