

A polymer formulation can pass every in-process quality check and still produce an off-spec tensile result at the end of the workflow. The cause may be hidden in a small interaction between resin lot, catalyst age, humidity, mixing energy, and instrument drift. Each individual measurement looks acceptable, but the trajectory across the experiment no longer resembles healthy batches.
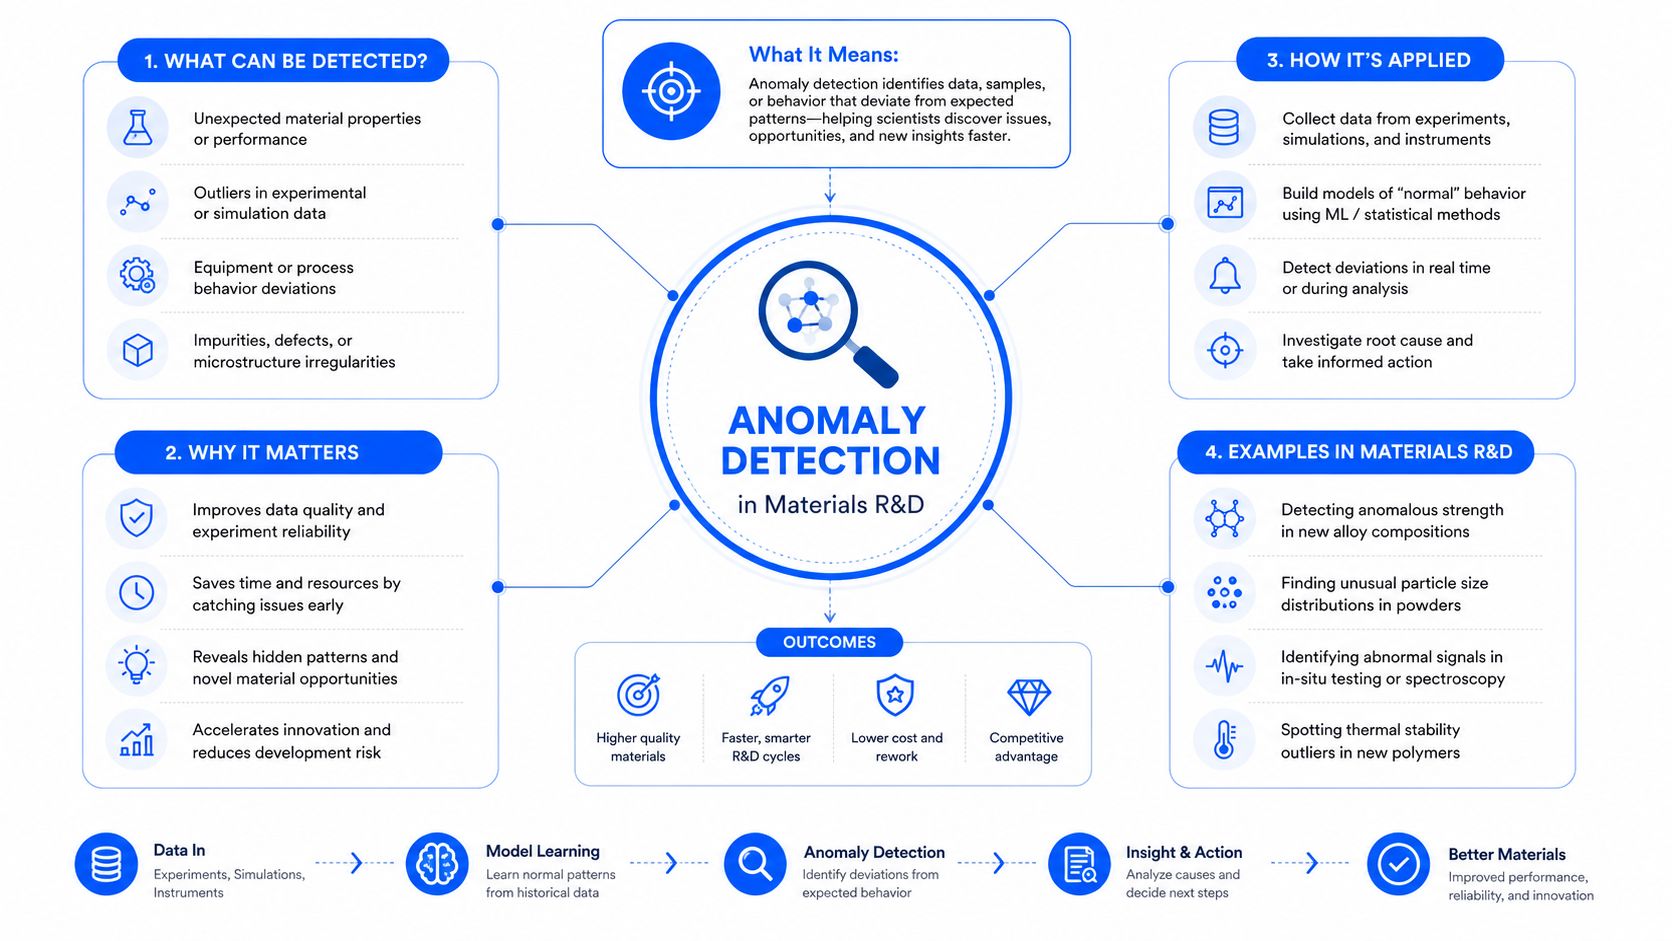
That's where anomaly detection becomes useful. It doesn't replace a chemist's judgment or prove that a batch is wrong. It identifies observations, combinations, or evolving patterns that deserve attention before they become an expensive repeat, a failed scale-up, or a questionable release decision.
Table of Contents
What Anomaly Detection Means in a Materials R&D Context
Suppose a polymer team records melt temperature, torque, die pressure, viscosity, particle size, and tensile strength across a formulation campaign. A traditional rule might flag viscosity only when it crosses a fixed specification limit. Anomaly detection asks a broader question: does this result behave as expected given the formulation, process conditions, instrument, and batch history?
That distinction matters because many R&D anomalies sit inside accepted operating windows. A gradual change in mixing torque may precede a property failure without violating any single control limit. A Raman spectrum may look plausible to the eye while differing from the spectral patterns associated with clean pigment lots. A formulation may be unusual not because one ingredient is extreme, but because an otherwise ordinary combination has never behaved that way before.
An anomaly is therefore a meaningful deviation from expected behavior, not merely a rare value. Materials datasets commonly contain three forms:
- Point anomalies are individual measurements, such as an unusually high viscosity reading or an isolated spectral profile.
- Contextual anomalies are normal-looking values in the wrong context, such as a temperature that's acceptable during one reactor phase but abnormal during another.
- Collective anomalies are sequences or groups whose combined behavior is unusual, such as a slowly diverging rheology curve across a batch.
Detection is different from classification
Supervised classification learns from labeled examples of acceptable and unacceptable outcomes. That works well when a team has consistent labels, but materials programs often have few confirmed failures and many partially documented experiments. Unsupervised anomaly detection instead learns the structure of normal data and highlights deviations. Semi-supervised methods take a practical middle path, training primarily on trusted normal runs while using the limited failure history for validation.
This field has a long history. Statistical quality control and industrial inspection preceded modern machine learning, with an early manufacturing precursor appearing in the 1930s literature. The familiar ±3σ rule covers about 99.7% of observations under a normal distribution, leaving roughly 0.3% outside the band, as described in this history of anomaly detection. Cybersecurity formalized the discipline further in the 1980s, while researchers applied methods such as neural networks and support vector machines during the 1990s.
For an R&D team, the practical roadmap is straightforward. First identify what “normal” means for each experiment, then match the algorithm to the data shape, evaluate it against real failure costs, and design a review process that turns a score into a scientific action.
Core Algorithm Families and How to Read Them
The right algorithm depends less on fashion than on what the data represents. A single viscosity value, a multichannel reactor trace, and a Raman spectrum need different definitions of normality.
Start with the data shape
Statistical methods are often the clearest starting point. A z-score, Grubbs test, or control chart can flag a viscosity or particle-size measurement that departs from a stable reference. These methods are transparent and useful when the baseline is reasonably stable. They become unreliable when the mean shifts after an instrument recalibration, a raw-material change, or a new process stage.
Distance-based methods ask how far a formulation sits from other formulations in a multivariate property space. k-nearest neighbors can identify a point with unusually distant neighbors, while Mahalanobis distance accounts for correlations between variables. That makes it useful when tensile strength, elongation, modulus, and density move together. Poor scaling, irrelevant features, and curved manifolds can distort the result.
Density-based methods look for regions with few neighboring observations. DBSCAN can separate clusters in spectroscopy or chromatography data, while Local Outlier Factor compares local density around a point with the density around its neighbors. These methods can detect a formulation that's unusual within its local chemical family, but they struggle when cluster density varies substantially.
Match reconstruction to complex signals
Reconstruction-based methods learn to reproduce normal observations. PCA can flag a large reconstruction error in a process sensor vector, and an autoencoder can learn more flexible representations for sensor streams, spectra, or microstructure images. A high error says that the observation doesn't fit the learned pattern. It doesn't automatically say which physical cause created the deviation, and the model can reconstruct a systematic failure if that failure appears too often in training data.
Probabilistic approaches represent likely data distributions. Gaussian mixture models can describe several formulation families, while Isolation Forest isolates rare points through random-tree path lengths rather than distance from a centroid or a density estimate. An empirical comparison reported an average ROC AUC of 0.77 for Isolation Forest and 0.514 for LOF across more than 30 datasets in that study, but the result doesn't remove the need for threshold tuning and domain validation, as explained in this Isolation Forest documentation and comparison.
Time-series methods focus on order and change. STL decomposition can separate trend and seasonality in reactor telemetry, seasonal hybrid ESD can detect departures from recurring patterns, and transformer-based detectors can model long dependencies across channels. These approaches are powerful when the sequence matters, but regime changes can look like faults unless the model knows whether the reactor is heating, reacting, cooling, or being cleaned.
| Family | Example Method | Best Suited To | R&D Example | Main Failure Mode |
|---|---|---|---|---|
| Statistical | z-score, control chart | Stable univariate measurements | Viscosity checks | Breaks under baseline drift |
| Distance-based | k-NN, Mahalanobis | Correlated tabular properties | Unusual formulation profile | Sensitive to scaling and geometry |
| Density-based | DBSCAN, LOF | Clustered chemical data | Spectroscopy families | Struggles with uneven densities |
| Reconstruction-based | PCA, autoencoder | Spectra, images, sensor vectors | Microstructure inspection | Can reproduce recurring failures |
| Probabilistic | Gaussian mixture, Isolation Forest | Mixed tabular datasets | Lot and formulation screening | Scores still need calibration |
| Time-series | STL, transformer detector | Ordered multichannel signals | Reactor telemetry | Confuses regime shifts with anomalies |
Practical rule: Use the simplest method that captures the failure pattern, then challenge it with historical runs and deliberately difficult edge cases.
Evaluation Metrics and Why Benchmarks Mislead
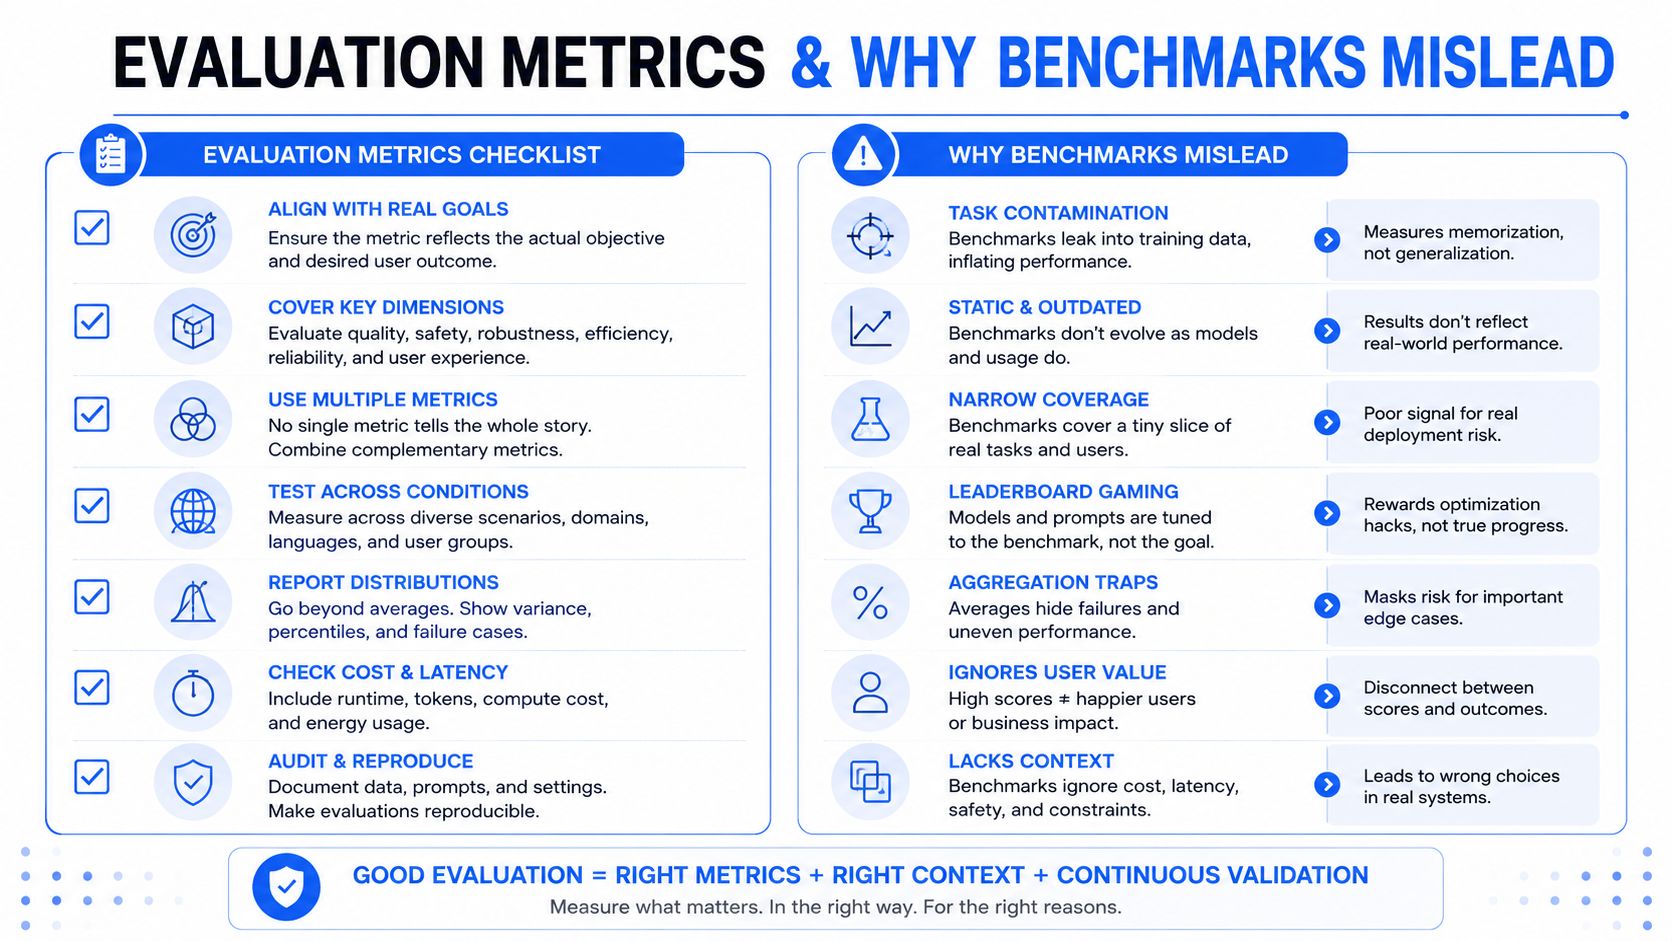
A model can produce impressive-looking alerts and still be unusable for a laboratory. The evaluation must reflect what happens after a flag appears. If scientists can review only a small number of experiments, precision at the available review capacity may matter more than a global score.
Precision measures how many flagged observations are relevant. Recall measures how many relevant anomalies the system catches. F1 balances those two measures, while PR-AUC is often informative when anomalies are rare. ROC-AUC can help compare ranking behavior, but it may look favorable even when the operational alert list contains too many false positives. Precision-at-k is especially practical when the team reviews only the highest-ranked flags.
Accuracy is a poor primary metric for rare-event detection. A system can label nearly everything normal and appear accurate while missing the failure that matters most. F1 has a related limitation. Two models can share an F1 score while differing sharply in whether they catch gradual equipment degradation, unusual chemistry, or harmless transcription errors.
Build validation around the experiment
Randomly splitting rows can leak information across related batches. A more credible evaluation uses:
- Time-based holdouts, which test whether the model handles later runs.
- Leave-one-batch-out validation, which tests generalization to a batch it hasn't seen.
- Contamination controls, which keep known anomalies from defining the normal baseline.
- Reviewer-capacity tests, which measure how many useful flags appear in the queue scientists can inspect.
A benchmark evaluated 30 algorithms on 57 datasets across 98,436 experiments and found that rankings were unstable across datasets, supervision levels, anomaly types, and noise conditions. Its conclusion is highly relevant to materials teams: algorithm choice should reflect the specific contamination regime rather than a universal winner, as documented in the benchmarking study on anomaly detection.
Choose metrics by decision cost
Ask whether a missed anomaly could affect safety, scale-up, release, or merely trigger a review. Then define the review burden, the acceptable false-alert level, and the evidence required to close an alert. A leaderboard can shortlist candidates, but your own batch structure and failure modes must decide the winner.
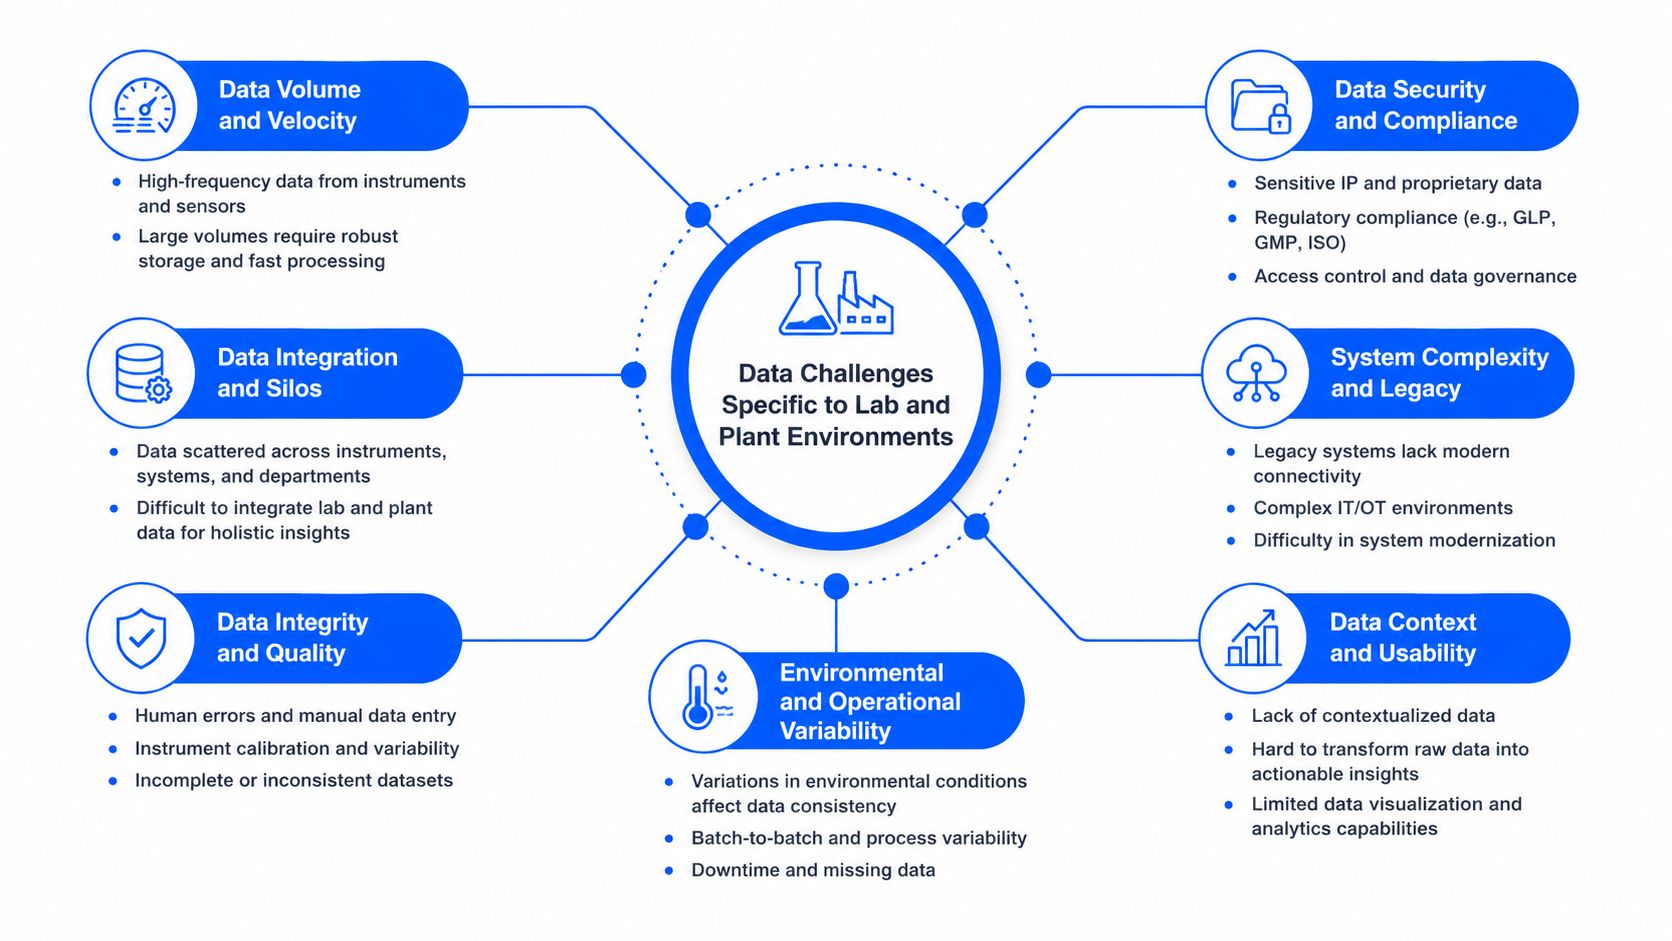
Data Challenges Specific to Lab and Plant Environments
Materials R&D rarely offers a clean table with a dependable anomaly label. A formulation campaign may contain a modest number of confirmed failures, many experiments with incomplete notes, instrument exports in different formats, and results collected under conditions that changed without being recorded consistently.
The first problem is limited supervision. Teams often know that a result was “wrong” without knowing whether the cause was sampling, preparation, equipment, raw material, or transcription. Training a classifier on those labels can teach the model the documentation habits of the lab instead of the underlying chemistry.
The second problem is baseline movement. Instrument drift, operator changes, seasonal humidity, maintenance, and new supplier lots can shift the distribution of measured features. A pooled density model may treat a legitimate post-maintenance shift as abnormal, while a fixed threshold may miss a subtle failure because the whole process has moved.
A polymer workflow makes the problem visible
Consider a characterization pipeline that combines formulation metadata, rheology curves, particle-size distributions, thermal analysis, spectra, and free-text observations. A new catalyst lot changes induction behavior. The resulting sensor traces remain smooth, and each individual value may fall within an established range. Yet the relationship between reaction timing, heat release, and final viscosity differs from historical batches.
A model trained on pooled data can fail in two ways. It may over-alert on every new lot because the feature distribution changed, or it may absorb the new behavior as normal before the team understands whether it represents a real process risk. Recent industrial anomaly detection research identifies data scarcity, evolving operating conditions, transfer across sites, and performance under domain shift as unresolved challenges, including in multivariate time series and industrial visual inspection, as discussed in this survey of industrial anomaly detection challenges.
The contrarian lesson: More historical data won't automatically solve a shifting-baseline problem. The team must preserve context about batches, instruments, sites, formulations, and process stages.
Useful safeguards include segmenting baselines by meaningful operating regime, recording feature provenance, retaining raw signals alongside derived features, and asking domain experts to review whether an apparent shift is chemically plausible before retraining.
A Practical Workflow for Deploying Anomaly Detection
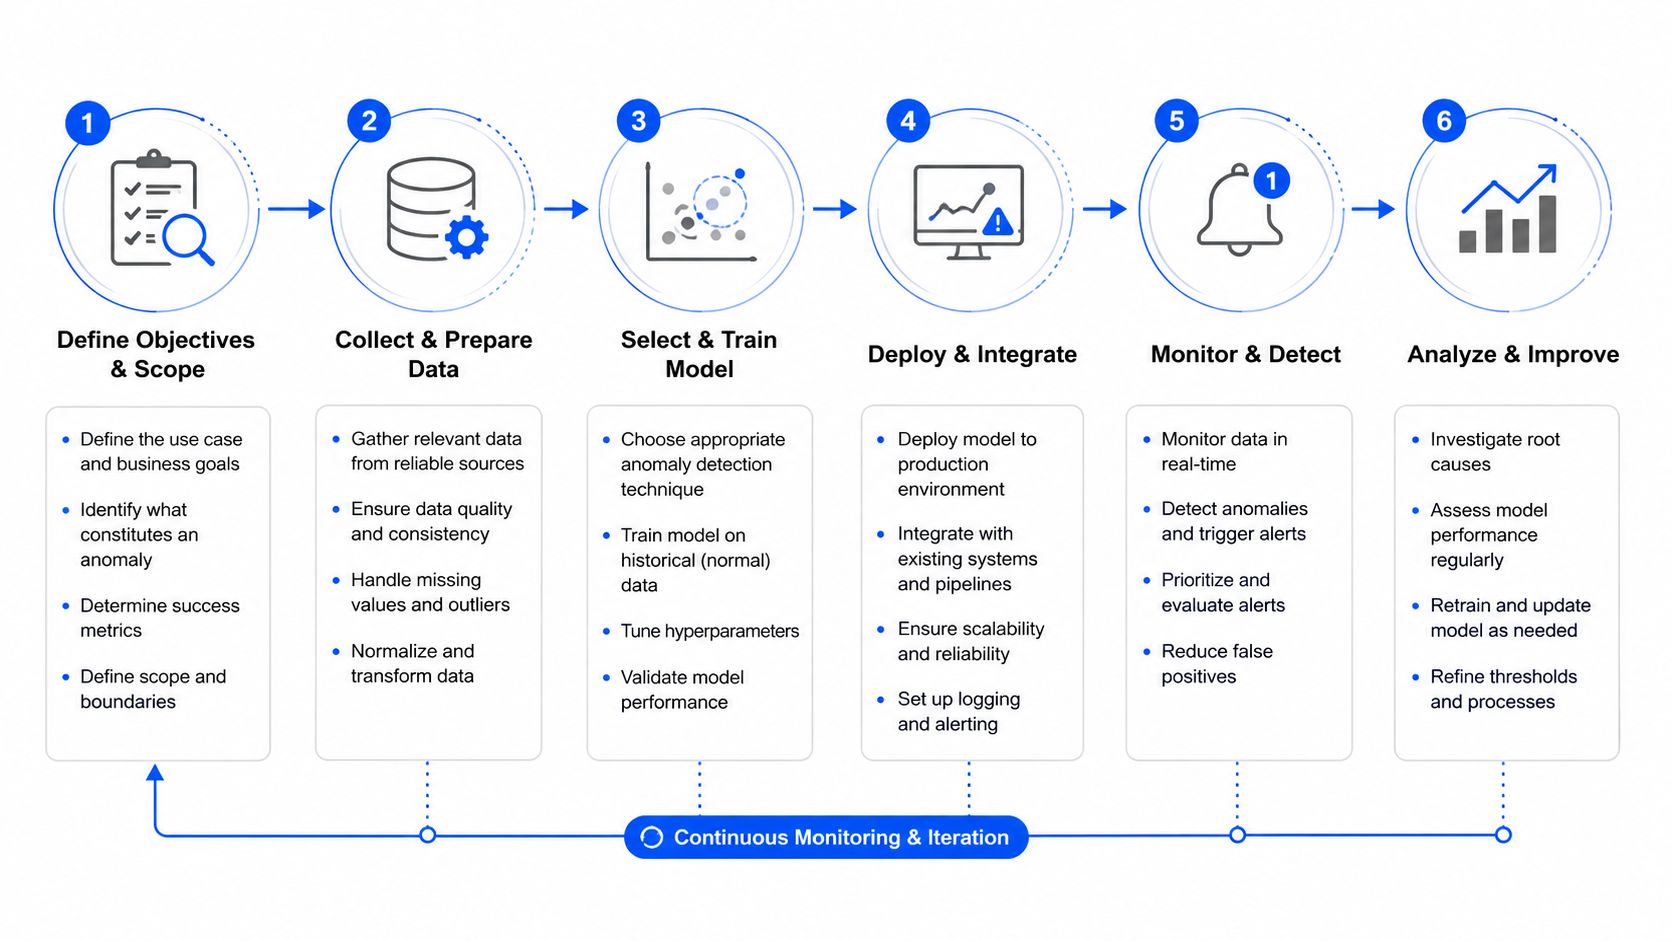
Deployment works best as a controlled extension of the experimental process, not as a model handoff to IT. The following workflow keeps scientific interpretation, data quality, and operational risk visible.
Establish the evidence base
1. Audit data readiness. Confirm feature provenance, timestamps, units, missing-value handling, instrument identifiers, batch boundaries, and links between raw files and final results. A quality-control reference such as the Herbilabs Labware quality control guide can help teams think through checkpoints before they automate review.
2. Decide what labels mean. Separate confirmed process failures, suspected anomalies, measurement errors, and unresolved observations. If labels are sparse, begin with trusted normal data and reserve uncertain cases for review rather than forcing them into a binary target.
3. Shortlist methods by data structure. Use statistical controls for stable single measurements, Isolation Forest or distance methods for tabular formulation screening, reconstruction models for spectra and images, and time-series detectors for ordered telemetry. Keep an interpretable baseline even if a more complex challenger looks promising.
Compare before you automate
4. Benchmark historical runs. Recreate the information available at decision time. Don't let later measurements, corrected records, or post hoc failure labels leak into the input. Examine alert examples, not just aggregate metrics.
5. Run a champion and challenger comparison. Freeze a holdout containing later batches or a separate operating regime. Compare the current method with at least one alternative, reviewing false positives, missed events, alert concentration, and explanation quality.
6. Roll out behind a gate. Start with shadow scoring, where the system generates alerts without changing release or experimental decisions. Set a maximum acceptable false-positive rate per 100 experiments based on reviewer capacity, then require an explicit approval before alerts influence quarantine, reruns, or scale-up.
Treat monitoring as part of the science
7. Monitor and retrain deliberately. Track input-distribution drift, score distributions, missingness, alert rates, reviewer outcomes, and changes in instrument or process configuration. Define retraining triggers before launch, such as a sustained baseline shift, a new instrument, a major formulation family, or repeated disagreement between model and reviewers.
The model should remain connected to the experiment record. A scientist needs to see the flagged observation, its comparison set, the contributing variables, relevant batch context, and the action taken. That audit trail turns anomaly detection from a dashboard decoration into a repeatable part of lab governance.
Case Examples in Polymers and Chemicals
The most useful anomaly detector doesn't merely identify a strange point. It exposes a signal that gives the team time to investigate while the material, machine, and records are still accessible.
In a polymer extrusion line, a multivariate statistical process-control model watches melt temperature, motor torque, and die pressure together. The important signal isn't a single limit breach. It's a coordinated, gradual change in torque and pressure that resembles developing screw wear. The team investigates before viscosity drifts out of specification, avoiding a shipment built from material whose process history was already deteriorating.
A specialty chemicals reactor presents a different pattern. An Isolation Forest scores reaction calorimetry and off-gas spectra across catalyst lots. One lot receives an unusual score because its induction behavior and gas-evolution profile don't match comparable batches. The team holds the lot for investigation before scale-up, rather than discovering the shifted catalyst behavior after committing larger quantities of material and production time.
In a coatings formulation lab, an autoencoder learns the structure of Raman spectra from accepted formulations. One formulation produces a large reconstruction error, with the spectral regions contributing to the error pointing investigators toward a pigment-related difference. The review traces the result to a contaminated pigment shipment, preventing the team from interpreting a raw-material problem as a formulation-design failure.
| Use Case | Signal Source | Method Used | Outcome Avoided |
|---|---|---|---|
| Polymer extrusion | Melt temperature, torque, die pressure | Multivariate statistical process control | Shipping material after unnoticed screw wear |
| Specialty chemicals reactor | Reaction calorimetry and off-gas spectra | Isolation Forest | Scaling a batch with shifted catalyst behavior |
| Coatings formulation | Raman spectra | Autoencoder reconstruction error | Misdiagnosing contaminated pigment as formulation failure |
These examples also show why context matters. The same torque value can be ordinary at one line speed and concerning at another. The same spectral difference can represent a new formulation design, a sample-preparation issue, or contamination. The detector narrows the search. Scientists still establish the cause.
Explainability and Adoption in Regulated Enterprises
A score without a decision path rarely earns trust in a regulated R&D environment. Scientists need to know what changed, why it matters, how certain the system is, and what action is appropriate.
Interpretability can come directly from the model. Isolation Forest can expose the features associated with isolation, while an autoencoder can report reconstruction error by sensor, wavelength region, or image area. PCA can show which components fail to reconstruct the observation. These outputs help a chemist distinguish a formulation issue from a temperature-recording problem.
Post-hoc methods add another layer. SHAP values can rank feature contributions, counterfactual samples can show what would need to change for an observation to look normal, and rule extraction can translate a complex score into a reviewable condition. None of these explanations proves causality. They provide structured hypotheses that a scientist can test.
Turn scores into actions
Every alert should carry more than a red flag. A useful review record pairs the anomaly score with a confidence indicator, comparison set, contributing variables, and a recommended next step:
- Investigate when the signal is plausible but the cause is unclear.
- Re-run when sampling or measurement error is credible.
- Quarantine when the anomaly affects a release or scale-up decision.
- Ignore with rationale when the deviation reflects an approved regime or documented change.
Recent work identifies explainability and hybrid methods as open issues because black-box systems can detect anomalies without clarifying causal drivers or actionable reasons. The research direction is moving from “spot the outlier” toward explanations, counterfactuals, and decision support, as discussed in this survey of explainable anomaly detection.
Build adoption into governance
A practical adoption pattern has four stages:
- Pilot on historical experiments with known issues and trusted normal runs.
- Embed review in the ELN or LIMS, so the alert appears beside the data scientists already use.
- Train users to read score distributions, not chase every isolated high score.
- Formalize human review through deviation management and CAPA processes.
For GxP environments, ISO 17025 laboratories, and other audited settings, teams should version models, log inputs and outputs, preserve training-data provenance, document threshold changes, and record the reviewer's disposition. Procurement teams should also ask whether the system supports open data formats, reproducible training, documented drift behavior, and clear escalation paths.
A materials platform can support this operating model when it unifies experimental records, preserves provenance, and connects predictions with explanations and historical precedents. Polymerize provides a centralized materials R&D data backbone through Polymerize Connect and offers explainable models that surface property relationships, confidence scores, and prior experimental context. Its enterprise controls include role-based access, ISO 27001 and SOC 2 controls, and GDPR and CCPA compliance, according to the Polymerize platform.
Adoption principle: Scientists don't need an alert that sounds intelligent. They need evidence they can inspect, challenge, document, and act on.
Start by selecting one workflow where missed deviations already create rework, such as formulation screening, spectroscopy review, or batch-release investigation. Then connect your experimental data, define the review actions and provenance requirements, and visit Polymerize to see how its materials R&D platform can support explainable anomaly detection and more targeted next experiments.
Put your R&D data to work
See how materials teams use Polymerize to plan fewer experiments and reach target properties faster.