
A lot of materials teams are already sitting on the data they need to make better decisions. They just can't use it well.
One group has formulation results in Excel. Another stores characterization files in instrument folders with cryptic names. Process notes live in email threads or ELNs. Failed experiments are barely documented, or worse, deleted from the “good” dataset. When leadership asks a simple question like “What changed between the last successful batch and this failed one?”, the team has to reconstruct the answer manually.
That's why what data integration is matters far beyond IT. In materials R&D, it isn't just the act of moving data from one system to another. It's the discipline of turning fragmented scientific records into a usable, searchable, explainable foundation for discovery.
Table of Contents
- Better decisions happen sooner
- Discovery depends on linked evidence
- Leadership should treat this as an innovation system
- ETL when control matters most
- ELT when flexibility matters more
- Streaming and virtualization for live access
- Comparison of Data Integration Approaches
From Scattered Spreadsheets to a Single Source of Truth
If you ask ten scientists where experimental knowledge lives, you usually get ten different answers. Some of it sits in spreadsheets. Some is trapped inside ELNs. Some remains attached to legacy instrument exports that nobody outside one subgroup knows how to parse. The data exists, but the team can't treat it as one body of knowledge.
That's the practical answer to what is data integration. It's the process of bringing data from separate systems, files, instruments, and applications into a unified structure people can use. In R&D, that unified structure should support three things at once: daily lab work, cross-project learning, and downstream AI modeling.
Why a single source of truth matters
A single source of truth doesn't mean every scientist uses one screen for everything. It means the organization has one trusted backbone where records can be linked across sample identity, processing conditions, measurements, and outcomes.
Without that backbone, teams waste time on avoidable questions:
- Which sample was this test run on?
- Did this formulation fail because of composition, processing, or measurement conditions?
- Are we comparing like-for-like data or mixing methods from different protocols?
- Did another team already try something similar and log the result somewhere else?
Practical rule: If a scientist has to open three files and ask two colleagues to interpret one result, the data isn't integrated.
The urgency is growing. The global data integration market is projected to grow from $15.18 billion in 2024 to $30.27 billion by 2030, driven by demand for real-time, AI-ready data foundations across industries, according to Integrate.io's market overview of real-time data integration growth.
What integration means in a lab setting
In a materials organization, integration usually starts with linking these categories:
- Experimental design data from spreadsheets, DOE tools, and formulation templates
- Execution records from ELNs, LIMS, and operator notes
- Instrument outputs such as spectroscopy, thermal analysis, microscopy, rheology, or mechanical testing files
- Contextual metadata like batch conditions, raw material lots, operators, timestamps, and protocol versions
A lot of companies treat this as cleanup work. That's a mistake. This is infrastructure for scientific learning. If the foundation is weak, every dashboard, every retrospective, and every AI model built on top of it will inherit that weakness.
Why Data Integration Is Crucial for R&D Innovation
In most enterprises, data integration gets framed as an efficiency project. In R&D, that framing is too small. The bigger payoff is scientific speed.
A materials team doesn't win because it stores data neatly. It wins because scientists can connect formulation choices to processing conditions, connect processing to structure, and connect structure to performance faster than before. That's where integrated data changes the pace of innovation.
Better decisions happen sooner
When teams work from disconnected records, decision-making slows down in predictable ways. Scientists can't trust comparisons across projects. Leaders can't see whether a failed scale-up came from recipe drift, equipment variance, or test method changes. Every review meeting turns into a data reconciliation exercise.
That's why one of the most useful market signals isn't about storage volume or pipeline throughput. It's about decision speed. After implementing integration solutions, 84% of users report a 5x increase in the speed of decision-making, and that matters in part because organizations use nearly 900 applications on average while connecting only 29% of them, according to Zipdo's data integration statistics roundup.
For an R&D organization, faster decisions usually mean:
- Fewer repeated experiments because prior work is visible
- Faster root-cause analysis when a formulation underperforms
- Cleaner handoffs from bench-scale work to pilot and production teams
- More credible AI outputs because the model sees linked evidence rather than isolated files
Integrated data shortens the distance between “something looks off” and “we know why.”
Discovery depends on linked evidence
A scientist rarely needs just one record. They need the chain. What was the composition? Which raw material lot was used? What drying conditions were applied? Which instrument method version generated the measurement? Were there anomalies noted by the operator? Did a similar sample fail under related conditions?
That chain is where hidden relationships appear. Not mystical insights. Practical ones. The filler loading that only works under a narrower temperature window. The cure schedule that improves one target property but hurts another. The experimental branch that looked unpromising until someone compared it against a different processing pathway.
Leadership should treat this as an innovation system
R&D leaders often approve modeling initiatives before fixing the data layer underneath them. That creates frustration fast. Teams buy AI tools, then discover the training data is incomplete, inconsistent, or missing the metadata needed to explain outcomes.
A more durable approach looks like this:
- Connect the records you already produce
- Preserve enough context to compare experiments properly
- Standardize what must be standardized
- Leave room for scientific variation where it matters
- Use the integrated backbone to guide next-best experiments
That's why data integration belongs in the innovation budget, not just the IT budget. It affects how quickly teams learn, how confidently they scale, and how often they avoid expensive dead ends.
Understanding Core Data Integration Approaches
Most explanations of data integration stop at acronyms. That doesn't help scientists or R&D leaders make choices. The useful question is simpler: how does the data move, when does it get cleaned, and what trade-offs come with that choice?
ETL when control matters most
ETL stands for extract, transform, load.
Think of ETL like a manufacturing line where raw material is inspected, cleaned, cut, and packaged before it reaches the warehouse. Data is pulled from source systems, transformed into a required structure, and only then loaded into the target environment.
ETL works well when the organization needs tightly controlled outputs. In R&D, that can be useful for validated reporting layers, executive dashboards, or compliance-facing data products where definitions must stay stable.
ETL is less attractive when scientists want to revisit raw records later. If the transformation step is too aggressive, useful detail can disappear before anyone realizes it mattered.
ELT when flexibility matters more
ELT reverses the order. You extract the data, load it first, and transform it inside the target environment later.
A simple analogy is a meal kit delivered to your kitchen. The ingredients arrive first. You decide how to prepare them based on the dish you want to make. That flexibility is why ELT fits exploratory science better than rigid pre-processing does.
In materials R&D, ELT is often the better fit when teams want to preserve raw instrument output, original lab notes, and evolving metadata so they can refine transformations over time. It supports reanalysis. It also reduces the risk of throwing away information too early.
Streaming and virtualization for live access
Not all data should wait for a batch run.
Data streaming handles information continuously as it's generated. This matters when the team wants near-real-time visibility from process sensors, pilot equipment, connected instruments, or manufacturing-adjacent systems. Streaming is useful when timing itself carries meaning.
Data virtualization creates a unified view across systems without physically moving all the data into one place first. It can help teams query distributed information quickly, especially when certain data must remain in its original system for operational or governance reasons.
Both approaches are useful, but both have limits. Streaming adds operational complexity. Virtualization can be convenient for access, but it's usually not the best backbone for heavier analytics or model training if the underlying sources are slow, inconsistent, or weakly governed.
Comparison of Data Integration Approaches
| Approach | Core Concept | Best For | Primary Limitation |
|---|---|---|---|
| ETL | Transform data before loading it into the target system | Stable reporting, governed datasets, predefined structures | Can remove detail too early |
| ELT | Load raw data first, then transform it in the target platform | Exploratory analytics, scientific reuse, flexible modeling workflows | Requires strong downstream governance |
| Data Streaming | Process data continuously as events occur | Sensor feeds, process monitoring, time-sensitive workflows | Harder to operate and monitor well |
| Data Virtualization | Create a unified view without physically consolidating all data | Fast cross-system access, distributed environments | Often weaker for heavy analytics and ML workloads |
A practical setup rarely uses just one method. Many R&D groups end up with a mix:
- ETL for curated business reporting
- ELT for research-grade raw and semi-structured data
- Streaming for live operational signals
- Virtualization for selective cross-system access
The mistake isn't choosing one tool over another. It's using the same integration pattern for every kind of scientific data.
The Anatomy of a Modern Data Integration Architecture
A modern integration architecture isn't one pipeline. It's a system of coordinated parts that move, standardize, store, and expose data for different uses.
What sits inside the architecture
At the top are the data sources. In materials environments, these are rarely uniform. You'll see ELNs, LIMS, spreadsheets, shared drives, pilot plant historians, partner data feeds, and instrument exports from systems that were never designed to interoperate.
Below that sits the ingestion layer. Within this layer, connectors, APIs, file watchers, and batch imports pull data into a common environment. Good ingestion design handles both routine sources and awkward ones. It should cope with changing schemas, partial records, and the reality that lab data often arrives late or out of order.
Then comes the transformation layer. Here, teams clean records, map identifiers, enrich metadata, align units, and establish relationships between entities such as experiment, sample, batch, process run, and measurement. In R&D, this layer should improve usability without flattening away the context scientists need.
The storage layer often combines warehouse-like structure for reporting with lake-like flexibility for raw and semi-structured scientific data. What matters isn't the label. It's whether the repository can preserve history, versioning, traceability, and enough detail for future analysis.
At the bottom are the consuming applications. These include dashboards, search tools, modeling environments, analytics workbenches, and AI systems that recommend the next experiment or explain likely property drivers.
Where lab environments usually break
The hardest part usually isn't the warehouse. It's the edge.
A recurring challenge is integrating data from legacy lab instruments and non-standardized chemical formats, where generic normalization can destroy the unique causal signals needed for accurate property prediction in materials science, as described in Aezion's discussion of data integration challenges.
That point matters. Many enterprise integration programs are built around a noble idea: standardize everything. In scientific environments, that can go wrong fast.
Don't normalize away the experimental reality. A weird field name is annoying. Losing the process condition that explains a property shift is expensive.
Common failure points include:
- File-level integration without entity mapping. Data lands in one place, but sample IDs, batch IDs, and method IDs still aren't linked.
- Over-cleaning at ingestion. Teams strip out notes, edge cases, and “failed” runs that later turn out to be informative.
- One schema forced onto every material class. This creates compliance on paper and confusion in practice.
- No lineage. Scientists can't tell which transformed table came from which source record or method version.
A sound architecture accepts that lab data is messy at the edges. It doesn't pretend otherwise. Instead, it creates a disciplined way to capture the mess, label it, relate it, and make it useful.
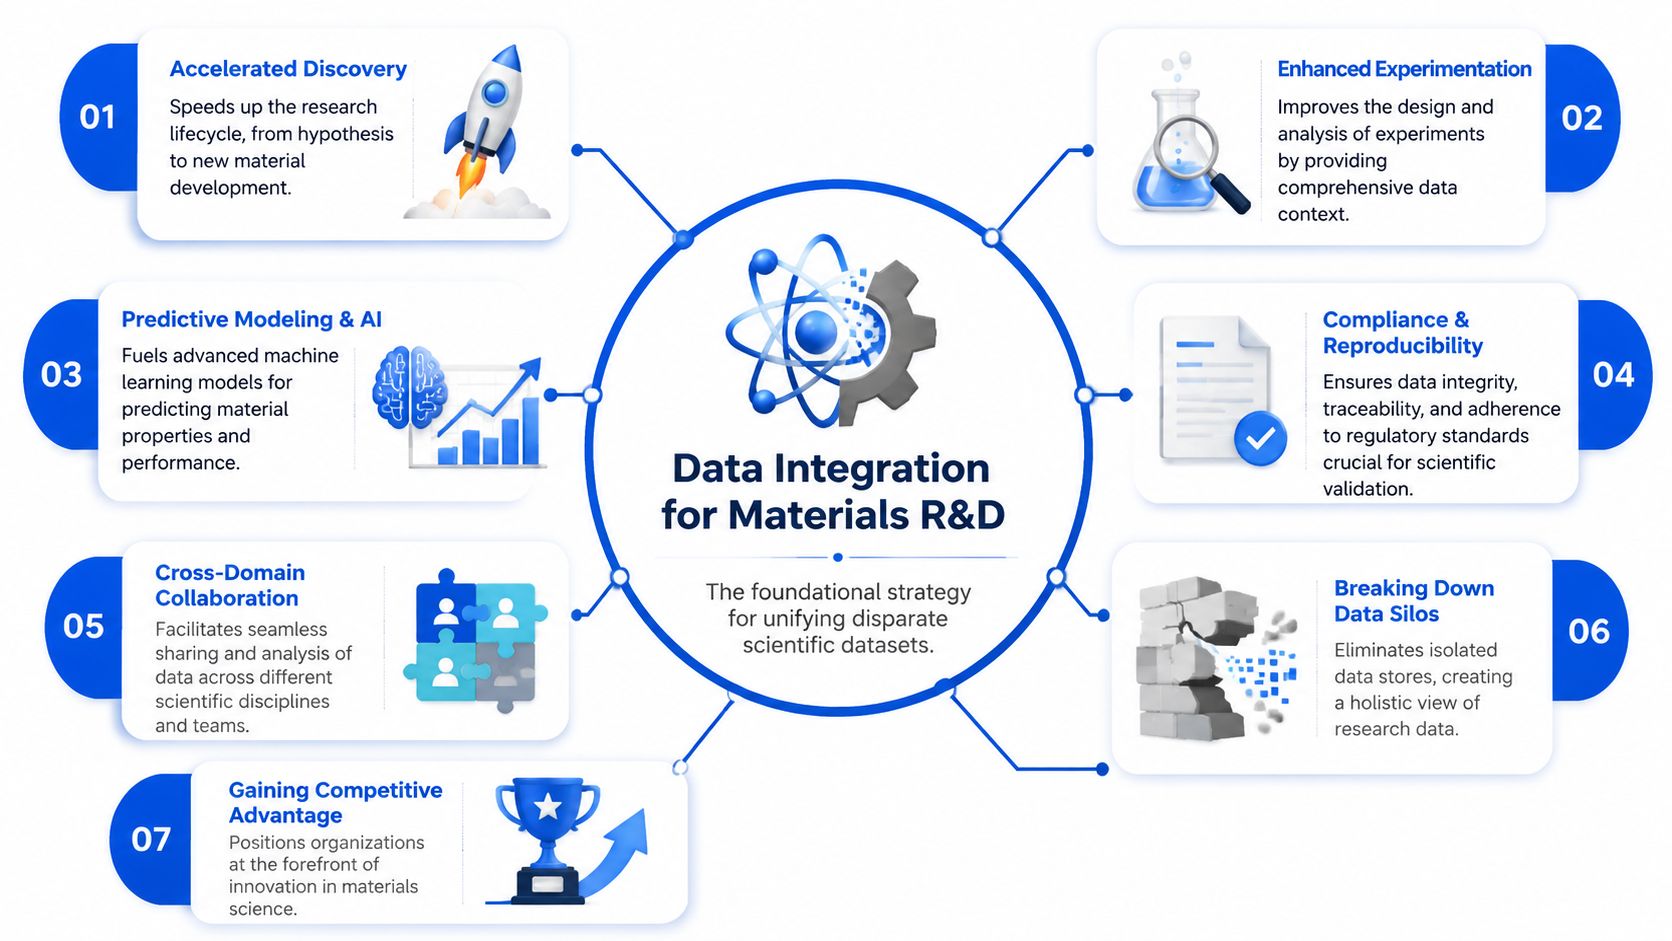
Beyond IT: The Data Integration Imperative for Materials R&D
Generic integration advice usually assumes the goal is clean analytics. That's not enough for science.
In materials R&D, data integration should preserve causal fidelity. That means keeping the conditions, decisions, and context that explain why a material behaved the way it did. If those signals are removed in the name of standardization, the integrated dataset may look tidy while becoming scientifically weaker.
Why context matters more than cleanliness
Consider two tensile measurements with the same reported value. In a generic business dataset, that may be enough. In a materials dataset, it isn't. The scientist may need to know sample prep history, humidity exposure, operator notes, machine settings, specimen geometry, and whether the run followed a revised protocol after an earlier failure.
Many standard integration programs fall short. They produce data that is schema-consistent but not scientifically complete.
The gap is especially visible in failed experiments. Those records often contain the sharpest learning signal. They show where a process window collapsed, where an additive interacted badly, or where a protocol broke under scale-up conditions. Yet failed runs are often stored poorly or omitted from the canonical dataset because they're seen as noise.
In materials science, “trusted data” doesn't just mean validated fields. It means the record still reflects what actually happened.
That distinction also shapes AI outcomes. Generic integration tools focus on trusted inputs for analytics, but in materials science, trusted means causally consistent. That gap affects whether teams can reach outcomes such as a 50% reduction in failed experiments, which requires an AI-native platform that preserves experimental context, as discussed in Nexla's overview of integration techniques and the limits of generic frameworks.
The five layers that make data scientifically reusable
For serious materials R&D, integration has to operate at the metadata level, not just the file-transfer level. A strong model is the five-layer FAIR metadata architecture:
Sample identity
The record of what the sample is. Composition, formulation, identifiers, and relationships to precursor materials belong here.Processing history
How the sample was made or treated. Mixing, curing, extrusion, coating, annealing, drying, aging, and other process steps need traceable records.Characterization records
Which methods were used, on which instruments, under which settings, and under which versioned protocols.Property and performance measurements
The observed results, along with uncertainty, units, test conditions, and quality flags.Analysis workflows
The scripts, models, transformations, and interpretation steps that turned raw observations into conclusions.
The critical detail is that each layer should embed provenance, uncertainty quantification, and versioning. According to the arXiv paper on FAIR metadata architecture in materials R&D, this approach directly causes a 30% to 40% increase in model training accuracy for composition-structure-property relationships compared with unstructured, siloed data.
That's the difference between integration as plumbing and integration as scientific infrastructure.
Activating Your Data Backbone for AI-Driven Discovery
Once the architecture is clear, execution comes down to operating discipline. Teams don't need a perfect enterprise master plan before they start. They do need a design that respects scientific context from day one.
A practical checklist for getting started
A strong R&D data backbone usually starts with a narrow but meaningful scope. Pick one workflow where fragmented records already slow the team down. Then build the backbone around that workflow with enough metadata discipline that it can expand later.
Use this checklist to keep the effort grounded:
- Start with entities, not files. Define how experiment, sample, batch, formulation, process step, and measurement relate to one another.
- Preserve raw data and transformed data together. Scientists need the ability to inspect both.
- Capture failed and ambiguous outcomes. Don't build a success-only dataset if you want reliable models.
- Version methods and schemas. Protocols change. Your data model should admit that openly.
- Apply role-based access and governance early. Sensitive IP needs structured access, not ad hoc folder permissions.
- Design for APIs and connectors. You'll need to connect instruments, ELNs, and downstream modeling tools without rebuilding the pipeline each time.
For teams that need outside implementation support, a specialized AI automation agency can help connect operational systems, automate ingestion, and reduce manual handoffs without forcing a generic enterprise pattern onto scientific work.
What good execution looks like
Good execution is boring in the right places. Scientists stop asking where the latest result lives. Data engineers stop writing custom one-off parsers for every review cycle. Leaders can trace a recommendation back to source records and method history.
A capable backbone should also support security and scale. In practice, that means enterprise controls such as role-based access, auditable lineage, and formal information security processes. It also means the data structure remains useful when the organization adds new material classes, new instruments, or new collaboration partners.
One more point matters. An AI-ready backbone isn't just a repository. It's a working system that helps teams ask better questions and act on the answers. The short overview below captures what that looks like when software is designed around scientific discovery rather than generic analytics.
When materials teams get this right, data integration stops feeling like overhead. It becomes the operating layer for faster formulation work, more reliable scale-up, and explainable AI that scientists will trust.
If your team is trying to turn fragmented experimental records into an AI-ready system of intelligence, Polymerize is built for that job. It helps materials R&D organizations unify data across spreadsheets, ELNs, instruments, and silos so scientists can preserve experimental context, train explainable models, and move from trial-and-error toward targeted discovery.
Put your R&D data to work
See how materials teams use Polymerize to plan fewer experiments and reach target properties faster.