
A formulation scientist opens a familiar workbook, searches an ELN for the experiment behind it, then checks a local instrument folder for the test file. The LIMS contains the sample identifier, while the ERP holds the production batch and inventory details. The result isn't one experiment record. It's a reconstruction exercise.
That fragmentation slows more than reporting. Scientists repeat searches, compare incomplete precedents, and spend time recovering formulation history, process conditions, sample lineage, and test-method details before they can decide what to try next. An AI model faces the same problem, but with greater risk. Raw values without scientific context can look precise while representing different materials, methods, or process states.
Multi source data integration provides the foundation for a better approach. It combines selected information from spreadsheets, ELNs, instruments, LIMS, ERP systems, simulations, and other sources into a coherent data backbone. The objective isn't to ingest everything immediately. It's to preserve enough meaning and lineage that scientists can trust the integrated record and AI can learn from it.
Table of Contents
- Data models provide the shape
- Ontologies provide shared meaning
- Provenance makes the record defensible
- Four checks that prevent downstream failure
- Instrumenting quality at every stage
- Governance protects reuse
- Start with decision-critical sources
- Build in controlled phases
- Measure outcomes without inventing precision
Introduction Why Fragmented Data Slows Materials Innovation
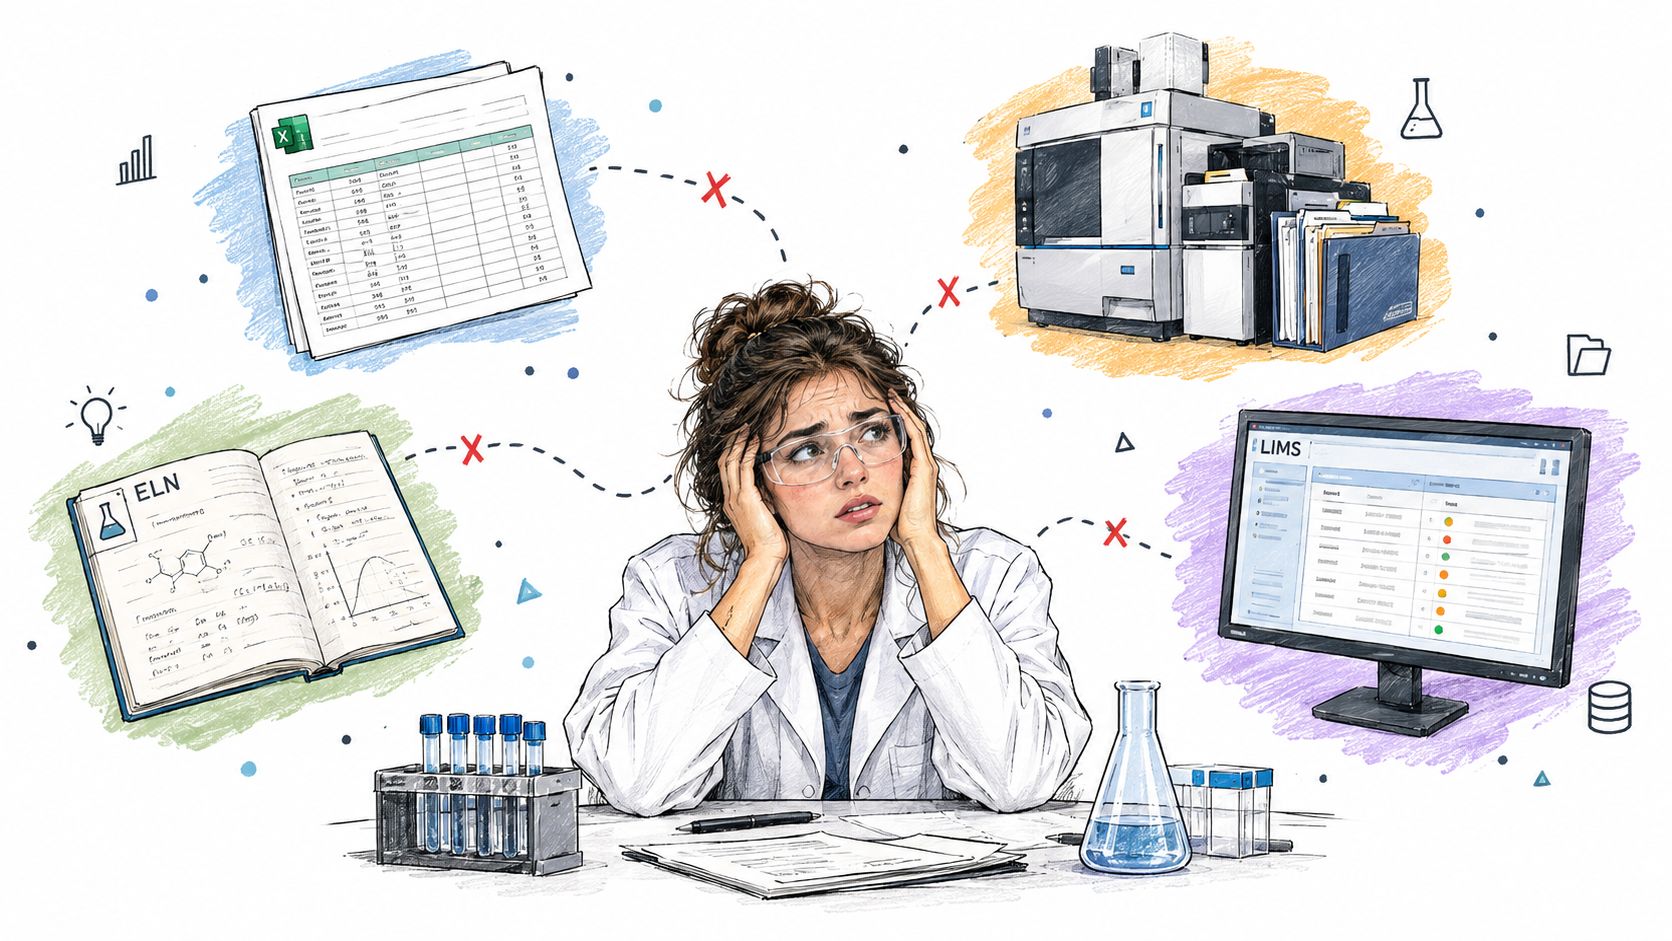
A materials program often starts with a reasonable division of labor. A chemist records formulation changes in Excel because it's fast. An experimentalist writes observations in an ELN because the work needs narrative detail. An instrument saves raw output in its native format. The LIMS tracks samples and test status, while the ERP manages inventory, purchasing, and manufacturing information.
Each system serves a purpose. The difficulty appears when a scientist needs to answer a cross-system question such as, “Which composition, processed under which conditions, produced this property, using which test method?” No single application holds the complete answer, so someone manually joins records by sample names, batch codes, dates, filenames, and memory.
The hidden cost of missing context
A spreadsheet may show a composition but omit the mixing sequence. An instrument file may contain a valuable curve but lack a clear connection to the formulation revision. An ELN entry may describe a processing anomaly in natural language without using the same material name as the LIMS.
These gaps create several forms of rework:
- Repeated investigation: Scientists search multiple repositories before deciding whether earlier work is relevant.
- Weak comparisons: Teams compare measurements that used different methods, conditions, or sample histories.
- Lost precedents: Useful experiments remain buried in personal folders or inconsistent naming systems.
- Slower scale-up: Process engineers must reconstruct how a laboratory result relates to production conditions.
The problem isn't merely that data sits in different places. The problem is that scientific relationships disappear when records are separated from the context that makes them interpretable.
Practical rule: A connected record is useful only when a scientist can understand what the material was, how it was made, how it was tested, and where every important value came from.
Why AI must come after integration
AI systems can identify patterns across experiments, but they can't reliably infer missing experimental meaning. If two records use different units, different test methods, or different definitions for the same property, combining them without qualification can create misleading training data.
A unified backbone changes the starting point. Instead of asking a model to learn from disconnected values, the organization gives it linked experimental objects that connect composition, process, sample, method, result, and decision history. Scientists can then inspect the evidence behind a recommendation rather than accepting an unexplained prediction.
The first integration win may be narrower than leaders expect. Connecting the sources that most influence an experimental decision often creates more value than attempting a broad ingestion program with unclear ownership and incomplete metadata.
What Multi Source Data Integration Means in Materials R&D
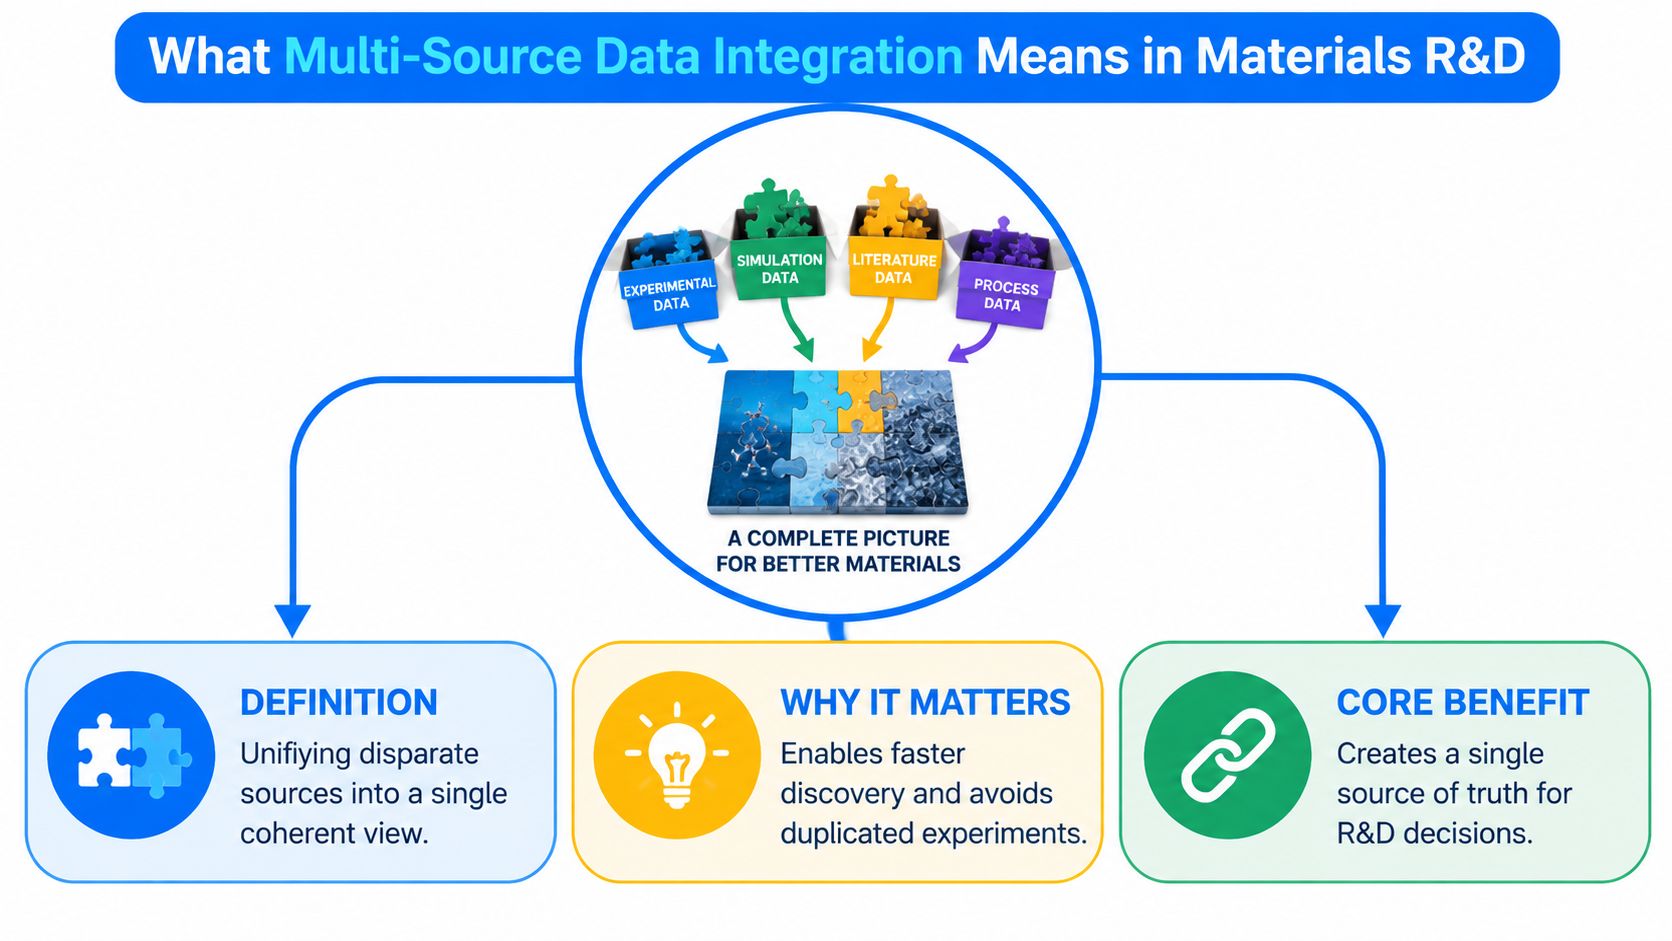
A formulation decision may depend on several records: the recipe, processing conditions, sample identity, test method, measured result, and the scientist's observations. These records can live in different systems and use different labels. Multi source data integration connects the records that describe the same scientific story while preserving their relationships and origins.
The United Nations Economic Commission for Europe defines data integration as combining at least two different data sources into a dataset. Its guidance identifies five common integration types: administrative sources with survey data, new data with traditional data, geospatial data with statistical information, micro data with macro data, and validation across sources. The definition and classification appear in the United Nations Economic Commission for Europe data integration discussion paper.
Integration can happen at different levels
A materials team does not always need to join every source at the individual-record level. Integration can occur at the micro level, through a common denominator, at aggregate levels, through modeling, or through a combination of these approaches.
An instrument result may link directly to a sample record. A production trend may be compared with laboratory results after both are summarized at the batch or site level. A model may combine sources when direct record linkage is unavailable. The suitable approach depends on the decision being supported and the identifiers each source contains.
Identifiers often fail to provide a complete connection. The World Bank's statistical matching guidance treats the combination of records from separate sources as a core technique when unique identifiers are unavailable. In R&D, one system may call a material “Batch A,” another may use an internal sample code, and a third may store only a filename. Matching therefore requires context, such as composition, processing date, instrument method, or project reference, along with a record of how the match was made.
The five types as a practical mental model
The formal categories map to familiar R&D tasks:
- Administrative and experimental data: Connect inventory, production, or compliance records with laboratory observations.
- New and traditional data: Relate modern instrument outputs or simulation results to established test records.
- Geospatial and statistical information: Add location context to process, environmental, or plant-level datasets.
- Micro and macro data: Link individual sample behavior with batch, site, or portfolio-level patterns.
- Validation across sources: Compare measurements or classifications from separate systems to identify disagreement and improve confidence.
Integration should serve a decision, not an ingestion target. Connecting the sources that explain a formulation choice or validate a process change can preserve more scientific context than collecting every available file. That lineage gives scientists a way to inspect an AI recommendation, trace its evidence, and judge whether the underlying comparison is appropriate. Multi source data integration is therefore a method for building trustworthy evidence when no single source captures the full materials story.
Common Data Sources and Architecture Patterns You Need to Know
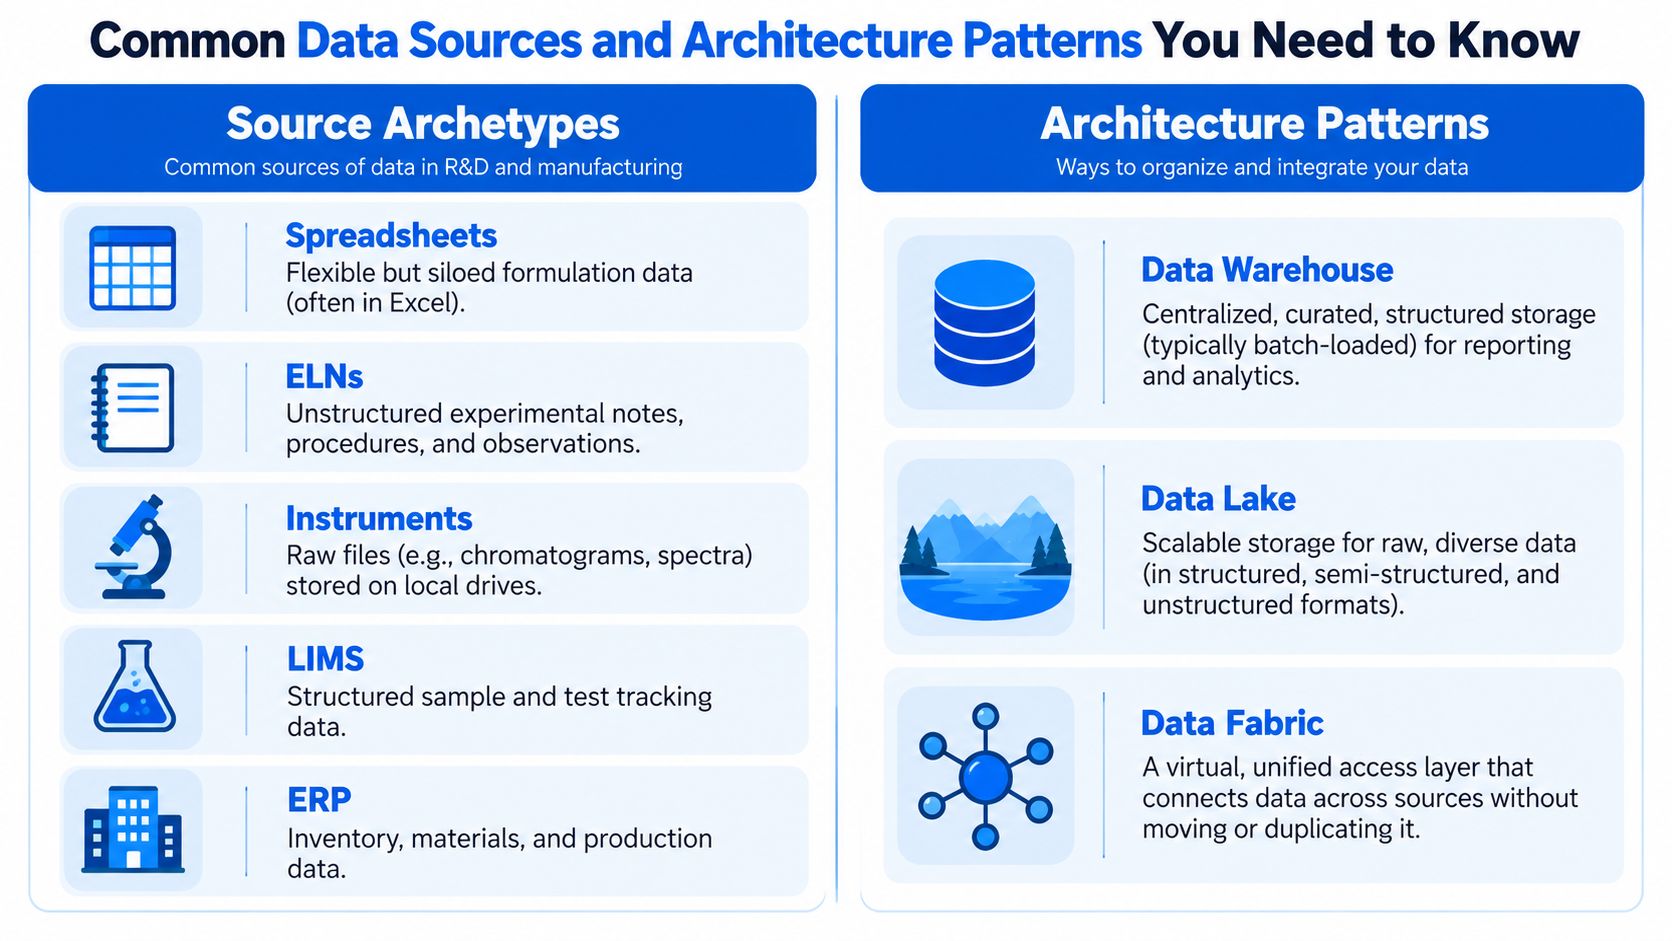
Materials R&D data has recognizable source archetypes, but each one carries different integration demands. A spreadsheet is flexible and easy to edit, yet it may contain inconsistent labels or hidden assumptions. An ELN preserves narrative context, while instrument files often preserve technical detail without the surrounding explanation.
Source archetypes in the lab
- Spreadsheets: Flexible formulation and design records, often with local naming conventions.
- ELNs: Experimental notes, observations, deviations, and procedural context.
- Instruments: Raw and processed files containing measurements, curves, images, or spectra.
- LIMS: Sample registration, test tracking, results, and laboratory workflow status.
- ERP systems: Inventory, purchasing, manufacturing, supplier, and production information.
The right architecture depends on what the team needs to do with these sources. Batch extraction may work for historical analysis, while a frequently changing operational workflow may need event-based updates. A central repository offers consistent control, while a virtual access layer can help teams query distributed information without moving every record.
Comparing architecture patterns
| Pattern | Best For | Trade-off to Consider |
|---|---|---|
| ETL | Curated pipelines where transformation must happen before storage | Early transformation can remove useful raw context if the design is too aggressive |
| ELT | Flexible analytics and iterative modeling in a warehouse or lake | Raw ingestion still requires strong governance, testing, and semantic modeling |
| Data warehouse | Structured, governed reporting and analysis | Less comfortable for highly varied raw files and unstructured notes |
| Data lake | Large volumes of raw, diverse data | Without metadata and stewardship, the lake can become difficult to navigate |
| Data fabric | Unified access across distributed systems | Virtual access can make cross-system joins, latency, and permissions harder to manage |
| Knowledge graph | Relationships among materials, processes, methods, and outcomes | Requires careful ontology design and ongoing relationship governance |
These patterns can also coexist. A team might retain raw instrument files in a lake, publish curated results to a warehouse, and expose relationships through a graph-oriented layer. Leaders comparing options should also consider the practical trade-offs outlined in this guide to system integration types and costs, particularly around maintenance, connectors, and system complexity.
Choosing without over-engineering
Start with the decision, not the architecture diagram. If scientists need to identify comparable formulations, the design must prioritize entity matching, property definitions, and experimental lineage. If process engineers need to compare lab and production outcomes, the integration must preserve batch, equipment, and condition relationships.
A visually impressive platform won't solve a weak scientific model. Architecture should make trusted context easier to find, validate, and reuse.
How Data Models Ontologies and Provenance Create Trust
Moving records into one repository doesn't automatically make them comparable. A data model establishes the structure, an ontology establishes shared meaning, and provenance shows how each value reached its current form. Together, they turn disconnected entries into a scientific record that another person can inspect and reproduce.
Data models provide the shape
A materials data model can represent a formulation, component, concentration, process step, sample, test method, result, and observation as related objects. It can also distinguish between a planned recipe and the actual recipe used, which is essential when a batch deviates from the intended procedure.
Without that distinction, an AI system may treat a target formulation as an experimental fact. With it, the system can separate what scientists planned, what they made, and what they measured.
Ontologies provide shared meaning
An ontology adds vocabulary and relationships. It helps teams distinguish a material from a sample of that material, a process condition from a result, and a property name from the method used to measure it.
This matters when different sites use different labels. “Tensile strength,” “tensile,” and a local abbreviation might refer to related concepts, but they may not be interchangeable unless the organization defines the relationship and preserves test-method details.
The model should capture the context around a value, not just the value itself:
- Composition: Components, grades, ratios, units, and formulation version.
- Process: Sequence, temperature, time, mixing, curing, drying, or other relevant conditions.
- Sample lineage: Parent material, split samples, rework, storage, and preparation history.
- Measurement: Method, instrument, calibration context, operator notes, and conditions.
- Outcome: Result, uncertainty where available, interpretation, and decision relevance.
Provenance makes the record defensible
Workflow systems can automatically capture provenance describing the data-generating process, transformations, historical analyses, and movement of data across systems. The research on provenance capture and reproducibility explains why this metadata is often stored separately for later auditing and reproducibility analysis.
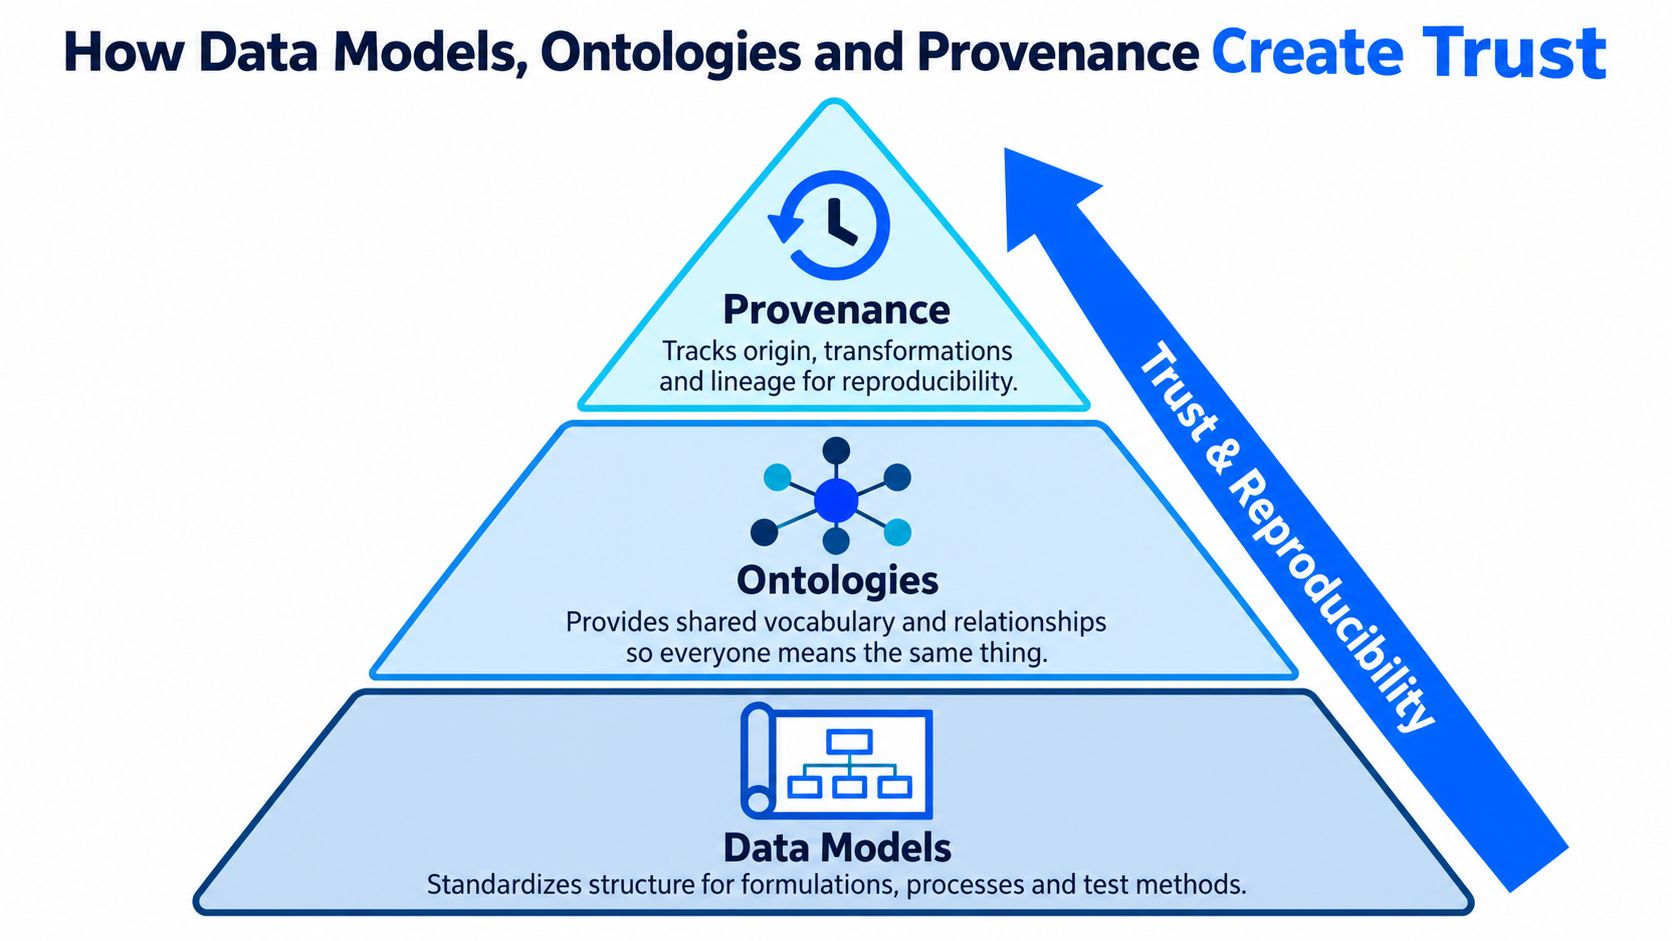
When sources disagree, provenance lets an analyst ask which source supplied the value, what transformation occurred, and whether the records describe the same scientific object. That traceability supports AI trust because a recommendation can be connected to historical precedents rather than presented as an isolated output.
A trustworthy integrated record doesn't hide disagreement. It preserves the disagreement, its origin, and the reasoning used to resolve or retain it.
Ensuring Quality Normalization Security and AI Readiness
Integration quality depends on a continuous pipeline, not a single import step. The key stages are schema matching, entity matching, value normalization, and conflict resolution. The technical discussion in the end-to-end data integration benchmark research emphasizes why real workloads need evaluation across the complete pipeline rather than isolated component tests.
Four checks that prevent downstream failure
Schema matching determines whether two fields represent the same concept. A column called “Temp” may refer to processing temperature, test temperature, or storage temperature. The system needs a defined mapping, not a guess.
Entity matching determines whether two records describe the same material, sample, batch, instrument, or supplier. Unresolved duplicates can inflate the apparent volume of evidence and make a material appear to have more independent observations than it does.
Value normalization makes representations comparable. Units, spellings, categorical labels, decimal conventions, and missing-value codes all need controlled treatment. Normalization must preserve the original value and transformation history so scientists can audit the result.
Conflict resolution handles disagreement between sources. A LIMS result and a spreadsheet entry may differ because one is preliminary, corrected, or tied to another test method. The right response isn't always to overwrite one value. The system should retain both when the distinction matters and record the rule used to select a preferred value.
Instrumenting quality at every stage
Production teams should attach measurable checks to each transformation. Examples include required-field validation, duplicate detection, allowed-value checks, unit checks, relationship checks, and comparisons against approved reference data.
Benchmarks such as TPC-DI and MaDI-Bench exist because integration systems must cope with heterogeneous formats and evaluate end-to-end behavior. In a materials environment, regression tests can confirm that a source-system change hasn't altered sample counts, broken lineage, or changed a property mapping.
A failed quality check should stop or quarantine affected data when the risk is material. Silent correction is dangerous because it can turn a visible data problem into an invisible scientific error.
Governance protects reuse
Governance determines who can access proprietary formulations, who owns a dataset, which version is approved, and how regional requirements apply. Coverage of multi-source consolidation challenges highlights compliance complexity, ownership conflicts, organizational silos, and trust as persistent barriers.
Role-based access, version history, auditability, and IP controls should be designed into the backbone. Scientists won't trust a system that exposes confidential formulations without clear boundaries, and legal or compliance teams won't approve reuse without traceable controls.
AI readiness therefore has two dimensions: technical quality and organizational permission. A clean dataset that nobody is allowed to use isn't ready. Neither is an accessible dataset whose scientific meaning can't be defended.
Implementation Roadmap KPIs and Pitfalls with Real Examples
A successful program usually begins with one decision that currently requires too much reconstruction. For example, a formulation team might need to identify which prior experiments are relevant to a target property, while a process team might need to connect laboratory recipes with production outcomes.
Start with decision-critical sources
Choose the smallest source set that can answer that question with defensible context. This might include a formulation spreadsheet, an ELN, and a test-results repository. Don't begin by promising to ingest every instrument, archive, and departmental database.
Define the experimental object before building connectors. Decide which relationships must survive integration, such as formulation to process step, process step to sample, and sample to test method. Assign owners for source definitions, mappings, quality rules, and access approvals.
Build in controlled phases
- Frame the decision: State the scientific question, users, required evidence, and acceptable data gaps.
- Profile the sources: Inspect schemas, naming patterns, units, missing context, duplicate entities, and update behavior.
- Create the minimum model: Represent the material, formulation, process, sample, method, result, and provenance needed for the first decision.
- Validate with scientists: Ask researchers to trace several records from source to integrated view and identify missing context.
- Operationalize checks: Add tests for mappings, duplicates, units, relationships, freshness, and source changes.
- Scale selectively: Add a new source only when it changes decisions or reduces a known reconstruction burden.
Measure outcomes without inventing precision
Useful KPIs should reflect scientific work rather than connector activity:
- Context reconstruction time: How long scientists spend finding formulation, process, and test history.
- Decision coverage: Whether the integrated record contains the evidence needed for a defined class of experiments.
- Failed or quarantined records: Which source or transformation creates recurring quality problems.
- Duplicate and conflict rates: Whether entity matching and resolution rules are working.
- Reuse of historical evidence: Whether scientists can find and apply relevant precedents.
- Scale-up continuity: Whether laboratory records remain connected to pilot or production information.
These measures help leaders distinguish activity from value. A growing source count isn't success if scientists still distrust the records.
The strongest first milestone is not “all data connected.” It's “one important experimental decision can be made without reconstructing the evidence by hand.”
Common pitfalls include treating ingestion as completion, flattening scientific context into generic rows, and allowing ownership to remain implicit. Schema drift can also break mappings when a source changes field names or value formats, while local naming conventions can create duplicate materials across sites.
Conclusion Building Your AI Ready Data Foundation
An AI project can begin with a simple question: which formulation should the team test next? If answering requires searching an ELN, spreadsheet, instrument file, and shared folder separately, the problem is not a lack of data. The scientific context is scattered.
The central principle is context over connectivity. A platform may link thousands of records, yet still fail as a trusted foundation if it loses formulation history, process conditions, sample lineage, or test-method details. Integration should preserve the chain of evidence, much like keeping every label and handling note with a sample as it moves through the laboratory.
Four principles keep the work grounded:
- Prioritize decision-critical sources: Connect the records that change experimental choices before expanding the program.
- Model lineage early: Keep composition, process, samples, methods, results, and transformations connected as scientific objects.
- Govern for trust: Establish role-based access, ownership rules, version history, audit trails, and IP protections from the beginning.
- Measure scientific outcomes: Track reconstruction effort, evidence reuse, data quality, and continuity from laboratory work to scale-up.
Statistical integration guidance treats multiple sources as a way to produce useful evidence, while statistical survey sampling review examines methods that support inference beyond reliance on one source. For materials R&D, the lesson is practical: integration is not merely an IT modernization project. It lets experimental knowledge accumulate without stripping away the conditions that give each result meaning.
Polymerize Connect can support this foundation by ingesting and standardizing data from ELNs, Excel files, databases, instruments, and laboratory silos into a centralized data backbone. Evaluate the platform by asking whether it preserves lineage, records transformations, supports governed reuse, and helps researchers move from scattered evidence to the next defensible experiment.
Begin with one decision currently solved through manual searching. Map its source records, define the context that must survive, and test whether scientists trust the resulting record. That proof gives R&D leaders a sound basis for expanding multi source data integration across formulations, sites, and production workflows.
Polymerize helps materials R&D teams unify fragmented experimental data, preserve scientific context, and create a governed foundation for AI-guided experimentation. Visit Polymerize to explore how its data backbone can connect spreadsheets, ELNs, instruments, and laboratory silos.
Put your R&D data to work
See how materials teams use Polymerize to plan fewer experiments and reach target properties faster.