


A pilot batch can pass every laboratory test and still fail when it reaches the plant. The extruder may show unexpectedly high pressure, molded parts may crack during demolding, and a film that looked clear in the lab may turn hazy at production scale. The investigation often starts with processing conditions, but the deeper issue can be the polymer itself, specifically the distribution of chain lengths hidden behind one reported molecular weight.
That's why molecular weight distribution is more than an analytical result. It's a decision-making lever that connects polymerization conditions to melt flow, strength, optical quality, and scale-up risk. Once you understand what the distribution means, how scientists measure it, and how chemists can deliberately reshape it, you can use the data to choose the next experiment rather than just explain the last failure.
Table of Contents
- Mn counts chains equally
- Mw gives heavier chains more influence
- Mz emphasizes the extreme tail
- Dispersity summarizes breadth
- Catalyst choice sets the starting profile
- Chain transfer changes chain length and breadth
- Polymerization mechanism matters
- Fractionation is a post-synthesis option
- Start with aligned experimental data
- Use models that support decisions
- Close the loop with the next experiment
Why One Molecular Weight Number Is Never Enough
Suppose two suppliers provide polycarbonate with the same reported average molecular weight. Both materials pass a basic viscosity check, and both look acceptable in a small injection-molding trial. At the pilot line, one resin fills the mold cleanly. The other raises extruder pressure, cracks during ejection, and produces a hazy film.
The difference may be hidden by the average. One resin can contain a modest population of very long chains. Although those chains make up only a small part of the sample, they can dominate entanglement and melt resistance. The other resin may contain more short chains and fewer extremely long chains, creating a different balance between flow, toughness, and process stability.
Molecular weight distribution describes the complete range of polymer chain lengths in a sample. Synthetic polymers are intrinsically polydisperse, so they contain chains of unequal length rather than one uniform molecular weight. The Agilent technical overview of polymer characterization explains why distribution data, together with number-average molecular weight, weight-average molecular weight, and dispersity, provides a practical foundation for polymer characterization.
The blind spot in an average
An average compresses information. It shows where a distribution is centered, but not whether most chains sit close to that center or whether the sample extends into substantial low- or high-molecular-weight tails.
Two groups of ropes can have the same average length. In one group, every rope is close to the average. In the other, many ropes are short and a few are extremely long. The arithmetic result matches, but the groups handle, stretch, and interact differently. Polymer chains behave in a comparable way, with the consequences appearing in viscosity, entanglement, diffusion, film formation, and fracture behavior.
Different parts of the distribution perform different jobs:
- Short chains can improve mobility and melt flow, but they may contribute less to entanglement and mechanical reinforcement.
- Long chains can increase entanglement, melt strength, toughness, and resistance to deformation, while also increasing processing resistance.
- The high-molecular-weight tail can affect behavior disproportionately because a small population of long chains may strongly influence viscosity and elasticity.
Practical rule: Treat the curve as part of the material specification. An average molecular weight without distribution context is an incomplete process-control signal.
What to ask for on a certificate
If a supplier reports only one molecular weight value, ask how it was measured and whether the full distribution is available. Confirm whether the result came from SEC or GPC, which calibration standards were used, whether the value is relative or absolute, and whether dispersity was reported.
The useful comparison is not which resin has the higher molecular weight. It is which resin has a distribution shape suited to the process. That answer helps a team choose the next experiment, adjust processing conditions, or use an AI platform such as Polymerize to predict and tune the distribution before making another batch.
The Statistical Averages Behind the Distribution
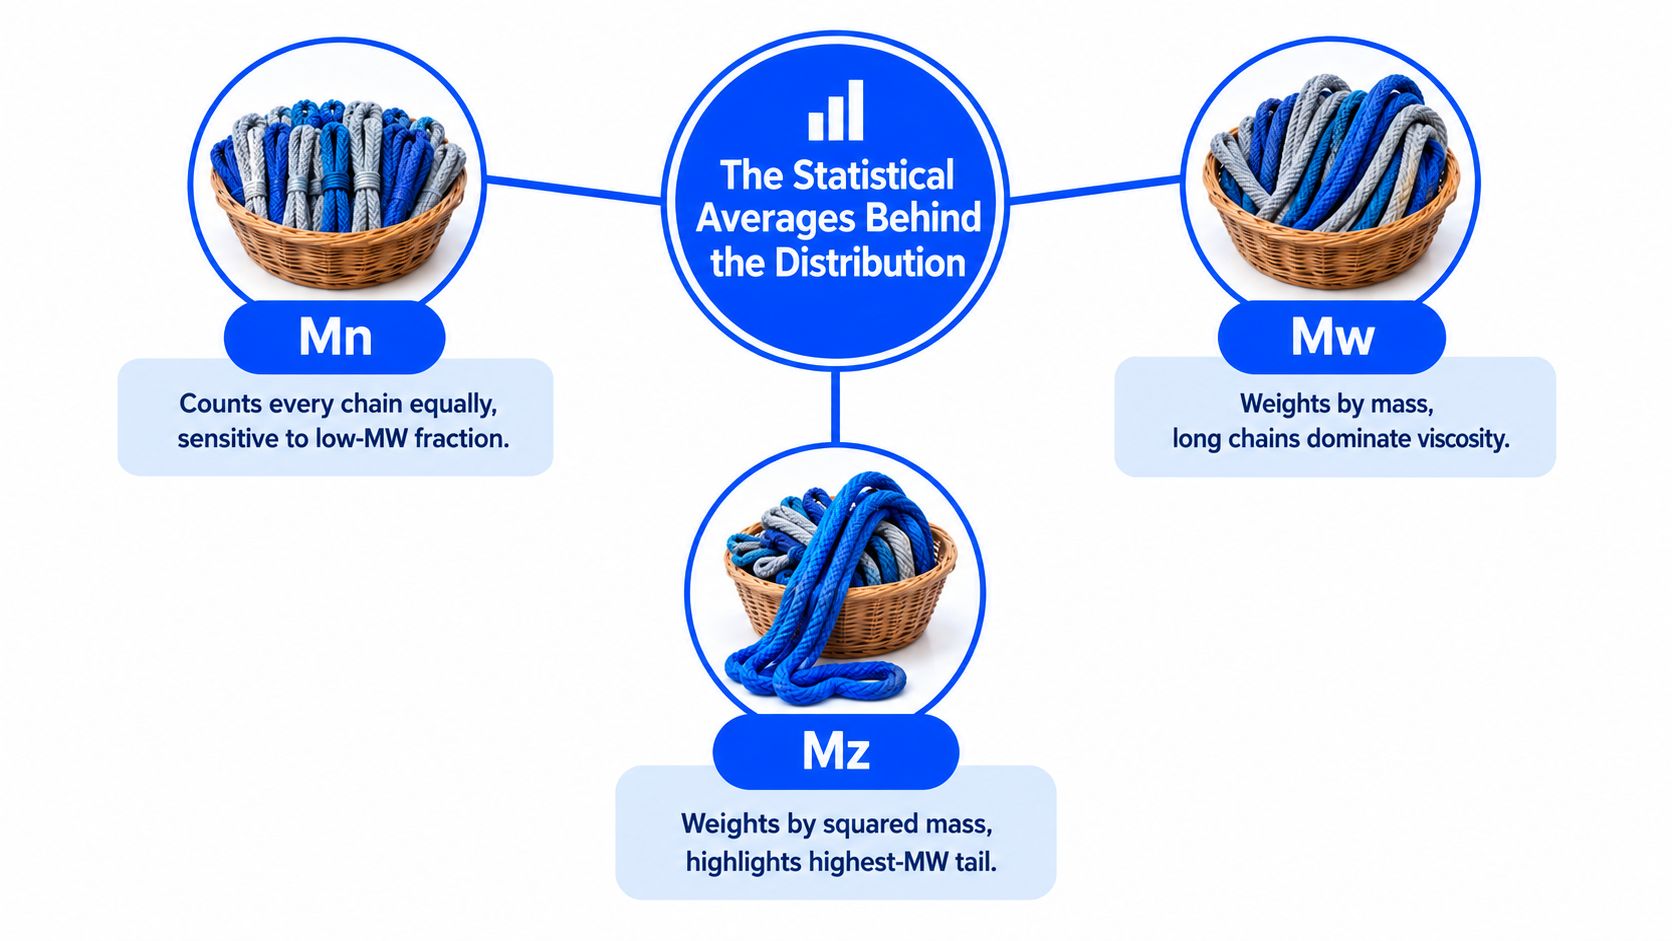
Suppose two resin samples contain chains ranging from short to very long. One average can describe the same collection differently depending on whether every molecule receives equal weight, heavier molecules receive more weight, or the longest chains receive disproportionate weight. Those three views produce Mn, Mw, and Mz.
Mn counts chains equally
Number-average molecular weight, Mn, answers this question: if every molecule gets one vote, what is the average molecular weight?
A large population of short chains pulls Mn downward because each chain contributes equally to the molecule count. Mn is therefore sensitive to the low-molecular-weight fraction. In a classroom analogy, Mn resembles the average grade when every student receives one vote, regardless of how much work each student submitted.
Mw gives heavier chains more influence
Weight-average molecular weight, Mw, gives greater influence to chains that contribute more mass. Long chains therefore count more than short chains, and a high-molecular-weight tail can raise Mw while leaving the visual center of the distribution nearly unchanged.
That difference helps explain processing behavior. Long chains often contribute strongly to entanglement and melt viscosity. Two polymers can have similar Mn values but different Mw values because their high-molecular-weight populations are different.
Mz emphasizes the extreme tail
Z-average molecular weight, Mz, weights the heaviest chains even more strongly. It can help describe a far high-molecular-weight tail, but it is also more sensitive to measurement noise, incomplete dissolution, baseline errors, and integration choices.
The Agilent characterization guidance includes Mn, Mw, and Mw/Mn in the standard reporting workflow. The practical point is that each average answers a different question. None replaces the full distribution curve.
Dispersity summarizes breadth
The ratio Mw/Mn is commonly called the polydispersity index, or PDI. IUPAC terminology generally prefers dispersity, Đ, for this measure. It gives a compact indication of distribution breadth, but it cannot show whether that breadth comes from a low-molecular-weight shoulder, a high-molecular-weight tail, or two distinct populations.
Narrow polymer standards are used as reference materials for evaluating separation and calibration quality. Their dispersity is close to one, although the exact value depends on the reference material and its specification. Real industrial polymers are generally broader, and their curves can have very different shapes.
A dispersity value tells you how wide the spread is. The chromatogram tells you where that spread lives.
That distinction matters when choosing the next experiment. A broad curve dominated by short chains can behave differently from one with a pronounced long-chain tail, even when both produce a similar Mw/Mn ratio. For an AI platform such as Polymerize, the curve and its averages are therefore decision inputs: together with processing results, they can help predict which distribution to target before another batch is made.
How Scientists Measure Molecular Weight Distribution
The routine workhorse is gel permeation chromatography, GPC, also called size exclusion chromatography, SEC. Dissolved polymer travels through porous columns. Smaller coils enter more pores and take longer to elute, while larger coils pass through more quickly. The instrument converts elution time into a molecular-size distribution, then uses calibration or detector information to estimate molecular weight.
Technical guidance published by the American Chemical Society on molecular weight distribution describes GPC/SEC as the common technique that directly characterizes the distribution rather than reporting only one average. Calibration uses narrow polymer standards, and the usable standard range can extend from below 5,000 g/mol to 10,000,000 g/mol under the guidance described in that source.
Choose the method for the question
SEC or GPC answers the distribution question best. It produces the curve and supports Mn, Mw, and dispersity calculations, but the result depends on solvent, column performance, calibration standards, detector response, and the assumption that hydrodynamic size relates appropriately to molecular weight.
Multi-angle light scattering, or MALS, can provide an absolute molecular-weight measurement when paired with concentration detection and appropriate optical parameters. It reduces reliance on conventional calibration standards, but it still needs careful sample preparation and a reliable refractive-index increment, often written as dn/dc. MALS may be coupled directly to SEC so the instrument can examine molecular weight across the eluting distribution.
Viscometry measures solution viscosity and uses intrinsic viscosity relationships, commonly through the Mark-Houwink equation, to estimate molecular weight. It's useful as a fast quality-control check, but a single viscosity-derived value won't reveal whether a tail or shoulder is present.
| Technique | What It Gives | Strengths | Limitations |
|---|---|---|---|
| SEC or GPC | Full molecular weight distribution, Mn, Mw, and dispersity | Direct routine view of the curve and distribution shape | Relative results depend on calibration, solvent, columns, and polymer conformation |
| SEC coupled with MALS | Distribution-linked absolute molecular weight information | Reduces dependence on conventional calibration | Sensitive to detector settings, dn/dc, concentration, and sample quality |
| Viscometry | Viscosity-derived molecular weight estimate | Fast and practical for screening or quality control | Doesn't resolve the distribution or identify tails |
The curve itself is a continuous measurement, not a set of independent categories. That's one reason it helps to distinguish a histogram from a bar graph. Querio's explanation of histograms versus bar graphs is a useful refresher when presenting chain-length data, because a molecular weight distribution represents continuous variation rather than separate named groups.
Where measurements go wrong
A poor calibration curve can shift the reported molecular weights. Band broadening can blur the distribution and hide shoulders. An unsuitable solvent can leave part of the polymer undissolved, while column aging and run-to-run drift can distort retention behavior.
Before interpreting a surprising tail as a chemistry result, check the measurement. Confirm dissolution, filtration, solvent quality, column condition, detector baseline, flow stability, and integration limits. A distribution is only as trustworthy as the path used to generate it.
What the Distribution Shape Does to Your Material
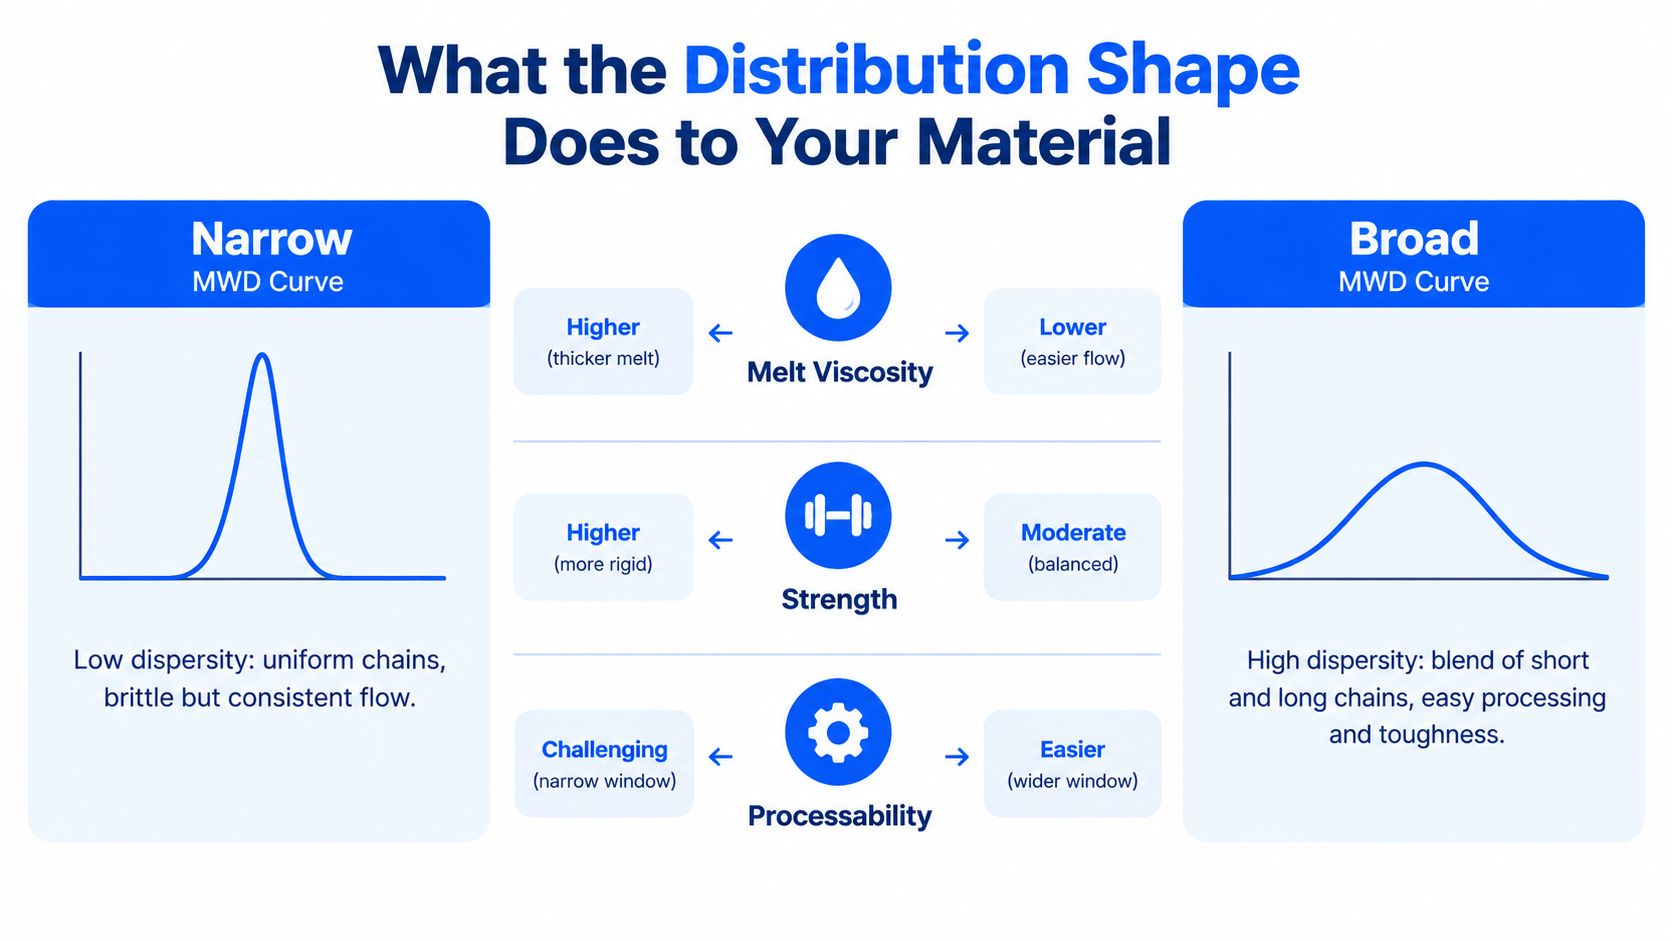
A polymer distribution acts like a built-in blend of chain roles. Short chains can move more easily and reduce resistance to flow. Long chains create more entanglement and can support melt strength, toughness, and resistance to deformation. The final behavior depends on the balance, not just on whether the distribution is labeled narrow or broad.
A broad distribution can therefore improve processing in some applications. The short-chain fraction helps the melt move, while the long-chain fraction helps a parison, sheet, or film resist sagging. That balance can support extrusion blow molding and thermoforming, where the material must flow through a die but retain shape afterward.
A narrow distribution often provides more uniform flow and optical behavior. It can be attractive for films or parts where predictable rheology and surface appearance matter. But a narrow material may lack the same blend of easy flow and long-chain reinforcement, so it isn't automatically superior.
Processing reveals what the chromatogram implies
Line operators often encounter the distribution indirectly. Melt flow index can shift as chain mobility changes. Die pressure can rise when the melt contains a strong high-molecular-weight contribution. Mold-fill behavior can change when the material's viscosity and elasticity respond differently to shear.
The high-molecular-weight tail deserves particular attention. It can increase melt strength and die swell, which may help a forming operation hold geometry. If the tail extends too far, however, the same benefit can become unstable pressure, poor surface finish, difficult mixing, or incomplete filling.
The low-molecular-weight fraction has its own trade-off. It may make processing easier, but an excessive short-chain contribution can reduce entanglement and weaken resistance to impact, creep, or stress cracking. The effect depends on polymer chemistry, temperature, strain rate, morphology, and the final product design.
Production clue: If melt flow, die pressure, and part toughness move in different directions, inspect the distribution shape instead of adjusting only the average molecular weight.
The following video offers a visual introduction to how molecular weight distributions influence polymer behavior.
Chemists can steer these outcomes by changing how chains start, grow, transfer, and terminate. The goal isn't to maximize or minimize dispersity in isolation. It's to create a distribution that gives the process enough flow and the product enough performance.
Ways to Narrow or Widen the Distribution on Purpose
Chemists control molecular weight distribution by changing the chain-growth environment. Catalyst selection, chain-transfer chemistry, polymerization mechanism, and post-synthesis separation each affect how uniformly chains are born and how long they survive.
Catalyst choice sets the starting profile
In polyolefin chemistry, catalyst families can produce distinctly different distributions. Ziegler-Natta catalysts can generate broader populations with a meaningful high-molecular-weight contribution, a profile that may support impact-grade polypropylene. Metallocene and constrained-geometry catalysts can produce more uniform ethylene polymers for films and elastomers.
The choice isn't about narrow versus broad. A catalyst also affects comonomer incorporation, branching, tacticity, active-site behavior, and the relationship between molecular structure and processing. A broader distribution may help a resin process across a wider operating window, while a tighter one may support more consistent film or fiber behavior.
Chain transfer changes chain length and breadth
Chain-transfer agents interrupt growing chains and start new ones. In polyethylene, hydrogen is a familiar transfer agent that lowers chain length and changes the melt response. In ionic polymerizations, a solvent or additive such as THF can influence chain activity and the resulting population.
The correct amount depends on the target resin. Too much transfer can push the material toward excessive short-chain content. Too little may leave a stubborn high-molecular-weight tail that complicates processing.
Polymerization mechanism matters
Free-radical polymerization naturally creates a range of chain histories because initiation, propagation, transfer, and termination occur through competing events. Controlled or living approaches such as ATRP, RAFT, and anionic polymerization give chemists greater control over when chains begin and how they grow, which can produce much narrower distributions for precision architectures such as block copolymers.
The ACS educational discussion of molecular weight distribution connects chain-length statistics to polymerization mechanisms, including stoichiometry in step-growth systems and transfer or termination in chain-growth systems. That connection is useful during troubleshooting because a changed distribution may reflect a changed reaction pathway, not merely an instrument artifact.
Fractionation is a post-synthesis option
Precipitation or solvent extraction can remove selected fractions from a broad resin and sharpen the remaining distribution. This approach can rescue an existing material when changing the polymerization route isn't practical, but it adds solvent handling, recovery, yield loss, and scale-up complexity.
| Method | Effect on PDI | Typical PDI Range | Common Use Case |
|---|---|---|---|
| Ziegler-Natta catalysis | Often broadens the population and can support a high-molecular-weight tail | Qualitative range depends on catalyst and process | Impact-oriented polyolefin grades |
| Metallocene or constrained-geometry catalysis | Often narrows the population through more uniform active sites | Qualitative range depends on catalyst and process | Films and elastomers requiring consistent behavior |
| Chain-transfer control | Changes average chain length and can reshape the breadth | Depends on transfer-agent level and reaction mechanism | Melt-flow adjustment in polyolefins and other systems |
| Controlled or living polymerization | Gives tighter control over initiation and growth | Can approach narrow distributions for suitable systems | Block copolymers and precision materials |
| Fractionation | Removes selected low- or high-molecular-weight fractions | Depends on cut points and recovery | Refining an existing broad resin |
These are expensive variables to explore one at a time. A model trained on reliable reaction and GPC data can help rank catalyst, temperature, feed, and transfer-agent combinations before the next synthesis.
Reporting MWD Data Your Team Can Actually Trust
A chromatogram becomes useful R&D evidence only when another scientist can understand how it was produced. Two curves that look different may reflect chemistry, calibration, sample preparation, column condition, detector drift, or software integration. Without method context, the team can't separate material variation from measurement variation.
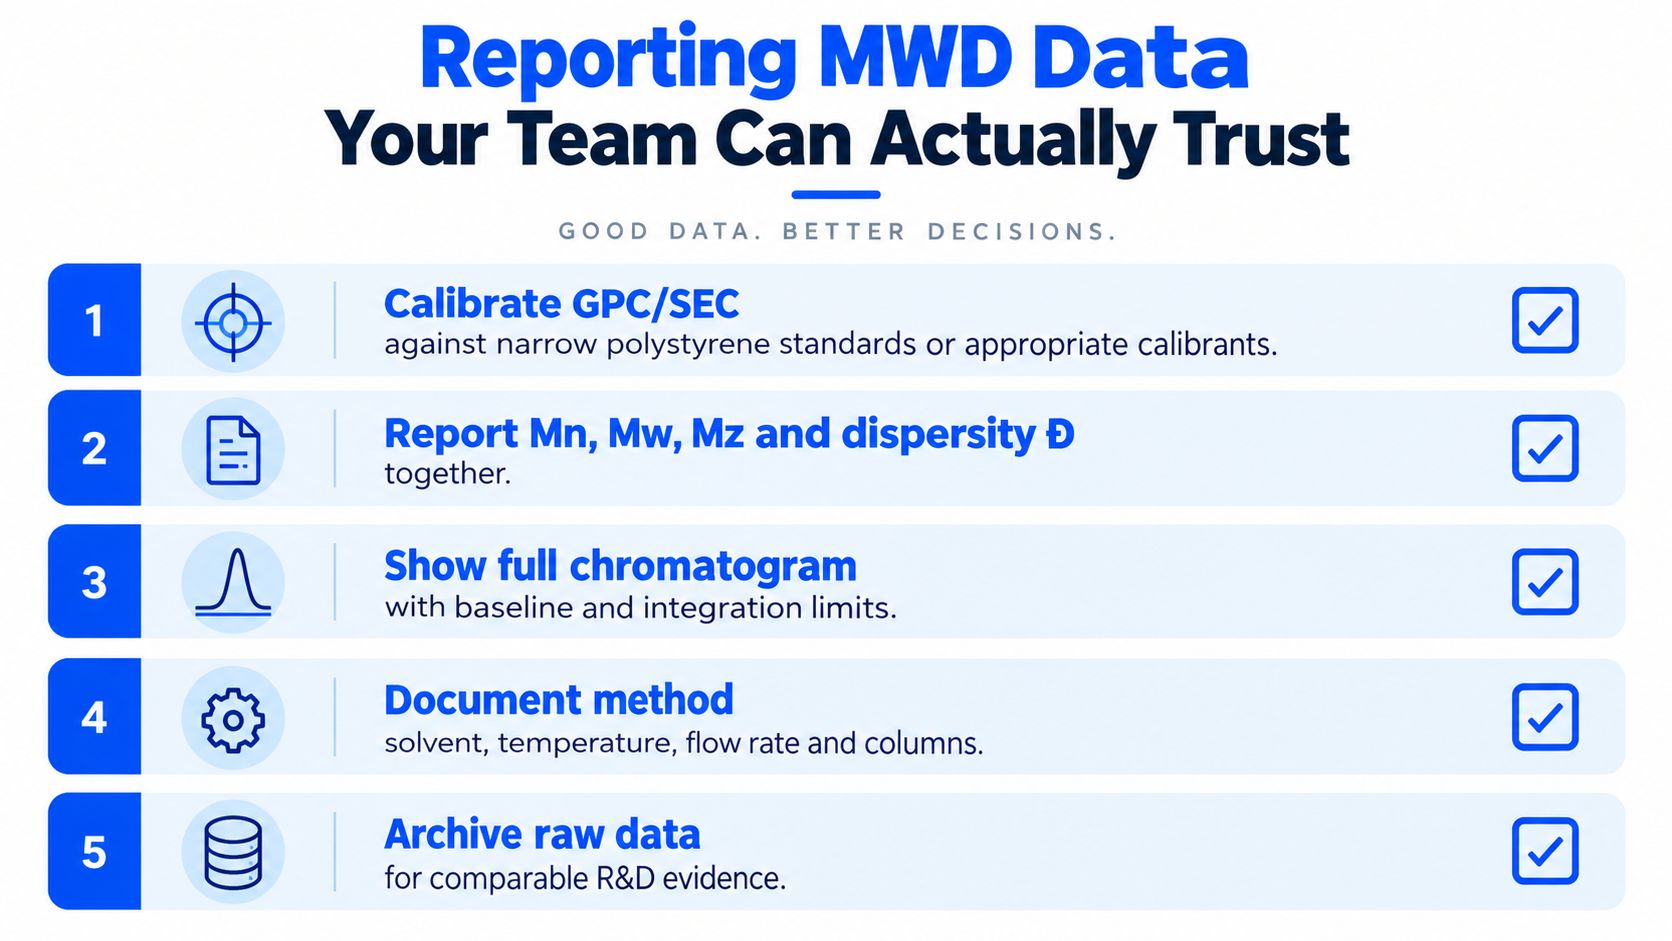
Start by defining the measurement basis. Conventional SEC often reports molecular weights relative to narrow polystyrene standards or another calibration set. An absolute approach, such as SEC coupled with light scattering, requires different detector and polymer parameters. Both can be valid, but the report must state which one was used.
Build a repeatable record
For each sample, preserve the full curve and the summary values together. Report Mn, Mw, Mz, and dispersity when the method supports them, and show the baseline and integration limits rather than sharing only a screenshot of the final numbers.
A practical record should include:
- Sample identity: Sample ID, synthesis batch, formulation or resin grade, and preparation method.
- Instrument method: Solvent, temperature, flow rate, column set, detector configuration, and calibration standards.
- Data provenance: Software version, operator, date, raw file location, and any processing or exclusion decisions.
- Repeatability: Replicate injections and run-to-run variation for the reported averages.
- Interpretation basis: Relative or absolute molecular weight, plus the relevant calibration or dn/dc information.
Use narrow, well-characterized standards consistently. The Agilent guidance describes narrow standards as the foundation for calibration curves and notes that standard concentration must be controlled across molecular-weight ranges to preserve separation quality. A team should also watch for aged columns, contaminated solvent, unstable baselines, incomplete dissolution, and incorrect light-scattering parameters.
Make the data auditable
Store raw chromatograms, processed outputs, calibration files, and method metadata together. If a tail changes between batches, the team should be able to determine whether the polymer changed or the analytical method drifted.
Good laboratory handling matters beyond polymer analysis. Teams building broader sample-preparation discipline can also consult this practical guide to bacteriostatic water handling, especially when documenting storage, contamination control, and preparation practices. The specific material differs, but the underlying principle is the same: controlled handling protects the validity of downstream measurements.
Audit question: Could a colleague reproduce the reported distribution months later without asking you what happened between the instrument and the spreadsheet?
That standard turns MWD from a one-off analytical snapshot into training data that can support reliable prediction.
Using AI to Predict and Tune the Distribution
Traditional molecular weight distribution development is often reactive. A chemist runs a polymerization, measures the resin by SEC, notices an undesired tail or breadth, and changes one condition for the next batch. That loop works, but it can consume material, instrument time, and development cycles before the team understands which variables control the curve.
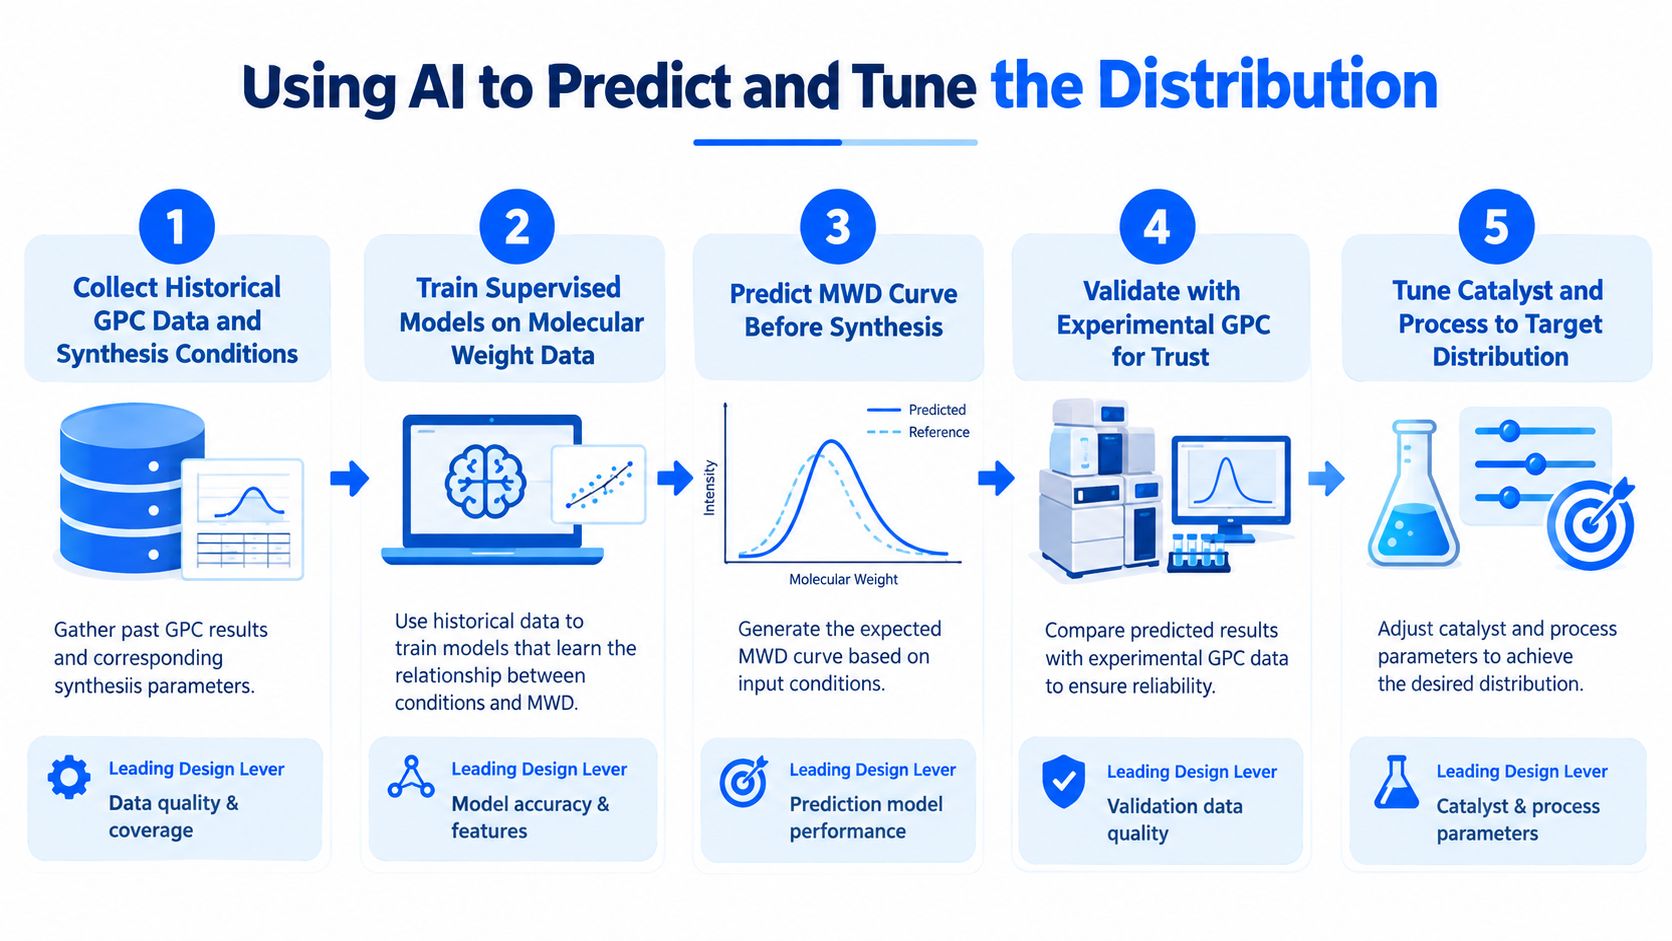
Machine learning can make MWD a leading design variable. The model learns relationships between reaction inputs and measured distribution outputs, then estimates likely behavior before synthesis. The prediction is only useful if the underlying data is disciplined.
Start with aligned experimental data
A useful training set links each calibrated chromatogram to the conditions that created it. Relevant inputs may include catalyst identity, monomer and comonomer feeds, initiator or chain-transfer levels, temperature profile, residence time, solvent, conversion, and work-up conditions. Replicate runs help the model distinguish reproducible chemistry from experimental noise.
The target shouldn't be limited to one number. A model can predict Mn, Mw, and dispersity, but a fuller system can also predict the distribution shape, including shoulders and tails. That matters because two recipes may produce similar summary values while creating different processing behavior.
Use models that support decisions
A supervised model can estimate MWD from historical synthesis conditions. A surrogate model can approximate a full distribution from a smaller set of feed and process variables, making it practical to screen many candidate conditions. An inverse-design loop starts with the desired curve, such as a controlled breadth with enough high-molecular-weight contribution for melt strength, then proposes feasible catalyst and process combinations.
Trust requires more than a visually attractive prediction. Test the model with y-randomization to check that it isn't finding accidental patterns, use leave-one-batch-out validation to evaluate performance on unseen batches, and show uncertainty bands around predicted distributions. A prediction with wide uncertainty may still guide an experiment, but it shouldn't be treated as a production specification.
Close the loop with the next experiment
The strongest workflow connects measurement, modeling, and planning. The team uploads traceable SEC results, trains models against the actual chemistry, predicts candidate distributions, runs the most informative experiment, and feeds the new result back into the system.
A platform such as Polymerize is designed for this kind of materials R&D workflow. Its value here is not replacing SEC or polymer expertise. It's helping scientists turn fragmented experimental records into a structured evidence base, compare candidate conditions, expose causal drivers, and select the next experiment with greater discipline.
Decision principle: Use AI to narrow the search space, not to hide uncertainty. The chemist still decides whether a predicted distribution is meaningful for the process and end use.
Polymerize helps materials teams connect experimental data, molecular weight distribution measurements, explainable models, and next-batch planning in one R&D workflow. Visit Polymerize to see how your team can predict and tune polymer behavior before committing to another trial.
Put your R&D data to work
See how materials teams use Polymerize to plan fewer experiments and reach target properties faster.