


Your team has an AI model that looks excellent in a demo. It predicts properties quickly, ranks formulations cleanly, and seems ready for production. Then the lab starts running follow-up experiments, and confidence drops. Results vary by operator, metadata is incomplete, old spreadsheet logic conflicts with ELN records, and nobody can say whether the model found a real causal signal or just learned patterns from messy history.
That's the point where performance benchmarking stops being an analytics exercise and becomes an R&D operating discipline.
Used well, benchmarking gives materials teams a repeatable way to compare experiments, models, workflows, and decisions against a clear reference point. Used badly, it creates false certainty. In materials R&D, that mistake is expensive because the benchmark doesn't just influence software selection. It shapes which experiments get funded, which formulations move forward, and which scale-up bets the business makes.
Table of Contents
- Generic software tests miss the scientific question
- Materials teams need proof of usefulness, not just speed
- Build one data backbone before you compare anything
- Structure the matrix to test causality, not just fit
Why Standard Benchmarks Fail Materials R&D
Most benchmarking advice still assumes a stable digital system, a clean dataset, and a narrow performance question such as latency or throughput. That logic breaks fast in materials development. Your real question usually isn't “Which model runs faster?” It's “Which workflow helps scientists make fewer bad decisions under messy, real lab conditions?”
Performance benchmarking has deeper roots than many teams realize. It became a formal management practice in the 1970s at Xerox, where the company compared its processes against industry leaders and expanded measurement beyond cost into quality, timeliness, and innovation, as outlined in this history of benchmarking. That evolution matters because materials R&D needs the same shift. Cost and speed alone don't capture scientific usefulness.

Generic software tests miss the scientific question
A generic benchmark often evaluates compute behavior in isolation. Materials teams work in a different reality:
- Experimental context changes the outcome. Sample prep, instrument settings, operator habits, and environmental conditions all influence whether a benchmark result holds up in the lab.
- Data lineage is rarely clean. The same formulation might exist in a spreadsheet, an ELN entry, and a slide deck with different naming conventions.
- Success isn't a pure software metric. A model that scores well on a held-out dataset can still send chemists toward dead-end experiments.
That's why IT-style benchmarking advice feels incomplete in R&D organizations. It helps you compare systems. It doesn't tell you whether a model improves the next experimental decision.
Practical rule: If your benchmark can't explain how it changes experiment selection, it's not yet useful for materials R&D.
Materials teams need proof of usefulness, not just speed
In this setting, a reliable benchmark has to answer three questions at once. First, is the result repeatable? Second, is the comparison fair? Third, does the output improve scientific decision-making?
That changes what you measure. Throughput and response time may still matter for production systems, but they shouldn't dominate benchmark design for formulation, property prediction, or scale-up planning. Teams need to evaluate whether a system helps identify viable formulations earlier, narrows the search space sensibly, and flags uncertainty before the lab spends time on the wrong path.
A benchmark that ignores causal reasoning is especially risky. Materials models often perform well when the training and test data share the same hidden biases. They look accurate until a chemist changes a resin family, additive package, processing condition, or supplier lot. Then the benchmark collapses because it measured pattern matching, not transferable understanding.
The right benchmark for materials R&D therefore looks less like a software shootout and more like a controlled scientific comparison. It has a baseline, a test matrix, repeatable conditions, and decision thresholds tied to experimental outcomes.
Laying the Foundation Goals Metrics and Baselines
Weak benchmarks usually start with weak goals. “Evaluate the model.” “Improve formulation performance.” “Assess the platform.” Those phrases sound reasonable, but they don't help a scientist, data lead, or R&D manager make a decision.
Start with the decision, not the dashboard
A usable benchmark begins with a business or technical choice that someone must make soon. Examples include selecting one predictive workflow over another, deciding whether to trust model-guided formulation ranking, or determining whether a new screening process should replace manual triage.
Use a short planning frame before you define metrics:
- State the decision. Be specific about what will change if the benchmark succeeds.
- Name the unit of comparison. Compare model against model, workflow against workflow, or lab process against lab process. Don't mix them.
- Define the failure condition. Decide what result would make you reject the approach.
- List what scientists care about. In materials teams, that often includes experiment hit quality, practical interpretability, and confidence in transfer across conditions.
Benchmarks become persuasive when they answer a decision the lab already cares about, not when they produce a polished dashboard.
Many teams often over-import software metrics. Queries per second, average inference time, or hardware utilization can be operationally relevant, but they rarely capture scientific value on their own. In materials work, stronger benchmark metrics often include experiment success rate, ranking quality of candidate formulations, prediction usefulness within known chemistry boundaries, and whether confidence estimates align with historical precedent.
Leaders in adjacent operational domains have the same problem. A KPI framework only matters if it reflects the actual work. That's why a logistics-focused resource like this guide on mastering KPIs for hauliers is useful as a contrast. It shows how sector-specific KPIs outperform generic scorecards. Materials R&D needs the same discipline.
Choose the right benchmark baseline
Benchmarking frameworks commonly group baselines into Historical, Competitor, and Industry benchmarks, and guidance recommends establishing a historical baseline first, as summarized in this benchmarking overview. That sequence is especially important in R&D because external comparisons are easy to misread when your internal process isn't yet stable.
Here's a practical selection framework.
| Benchmark Type | Primary Use Case | Data Source Example | Strategic Advantage |
|---|---|---|---|
| Historical | Compare current workflow against your own prior performance | Past formulation campaigns, archived screening runs, legacy model outputs | Gives context grounded in your chemistry, instruments, and team habits |
| Competitor | Compare against a peer method or vendor claim | External model evaluation, side-by-side workflow trial, alternate software stack | Helps assess relative position when procurement or platform selection is involved |
| Industry | Compare against a broader standard or published operating target | Third-party standards, shared benchmarking frameworks, common process expectations | Useful for executive communication and broader strategic alignment |
Historical baselines do more than provide a starting number. They reveal your actual operating variance. If your historical records show large swings in measurement quality, then a “better” model result may be exploiting inconsistency.
A good baseline also has boundaries. If you're benchmarking a model for polymer formulation, don't use historical data from incompatible chemistry spaces just because the files are available. That turns benchmarking into an archive exercise rather than a valid comparison.
Use fewer metrics than you think you need. Teams often build benchmark scorecards that are too broad to govern a decision. A smaller set of decision-grade metrics is better than a larger set that nobody trusts.
Designing the Test Matrix for R&D and AI Models
The test matrix is where good intentions usually meet operational reality. In materials programs, the biggest issue is often upstream. You can't benchmark fairly when the underlying experimental records are fragmented, mislabeled, or missing context.

A major challenge is that 70% of experimental data is fragmented across spreadsheets, ELNs, and silos, and common benchmarking guidance doesn't give teams a practical protocol for validating AI causal inference when metadata is inconsistent, as described in this APQC discussion of benchmarking gaps. That number explains why so many benchmark projects stall before they produce a credible result.
Build one data backbone before you compare anything
If a formulation name changes across systems, or if test conditions are stored as free text in one source and structured fields in another, your benchmark will gradually drift. The first job is data normalization.
That means creating a common structure for:
- Material identity. Resin families, additives, fillers, suppliers, and lot references need one naming standard.
- Process conditions. Mixing order, cure profile, temperature, pressure, dwell time, and machine settings should be captured in comparable fields.
- Outcome variables. Mechanical, thermal, rheological, barrier, and durability results need clear units and test methods.
- Versioning. Every model run and every experimental revision should map back to the exact data snapshot used.
Without that backbone, teams often compare a model trained on one interpretation of the data against a baseline assembled from another. The result may look precise. It isn't fair.
Structure the matrix to test causality, not just fit
A useful materials benchmark matrix should force the model to prove something harder than interpolation on clean data. It should test whether the system identifies variables that remain important when conditions shift.
Use a matrix with deliberate contrasts:
- Known chemistry versus adjacent chemistry. Start with familiar formulation families, then test nearby but not identical conditions.
- Stable protocols versus changed process settings. This shows whether the model learned material behavior or merely memorized a common procedure.
- High-confidence recommendations versus low-confidence recommendations. Scientists need to know whether confidence scores line up with real-world reliability.
- Human-first selection versus model-guided selection. Compare the quality of downstream experiments, not just the raw prediction score.
A benchmark matrix should also include a control group. In practice, that might be the incumbent screening workflow, a simpler statistical model, or scientist-led candidate ranking without AI assistance. If you skip the control, you can't tell whether the benchmarked system is adding insight or just adding complexity.
Later in the process, it helps to align stakeholders on what a disciplined comparison looks like in practice:
One more design choice matters. Don't let your matrix become too clean. A benchmark that strips away realistic noise may flatter the model and fail the lab. Include the kinds of ambiguity scientists face, but document them so the analysis can separate data quality problems from model performance problems.
Execution and Analysis From Raw Data to Real Insights
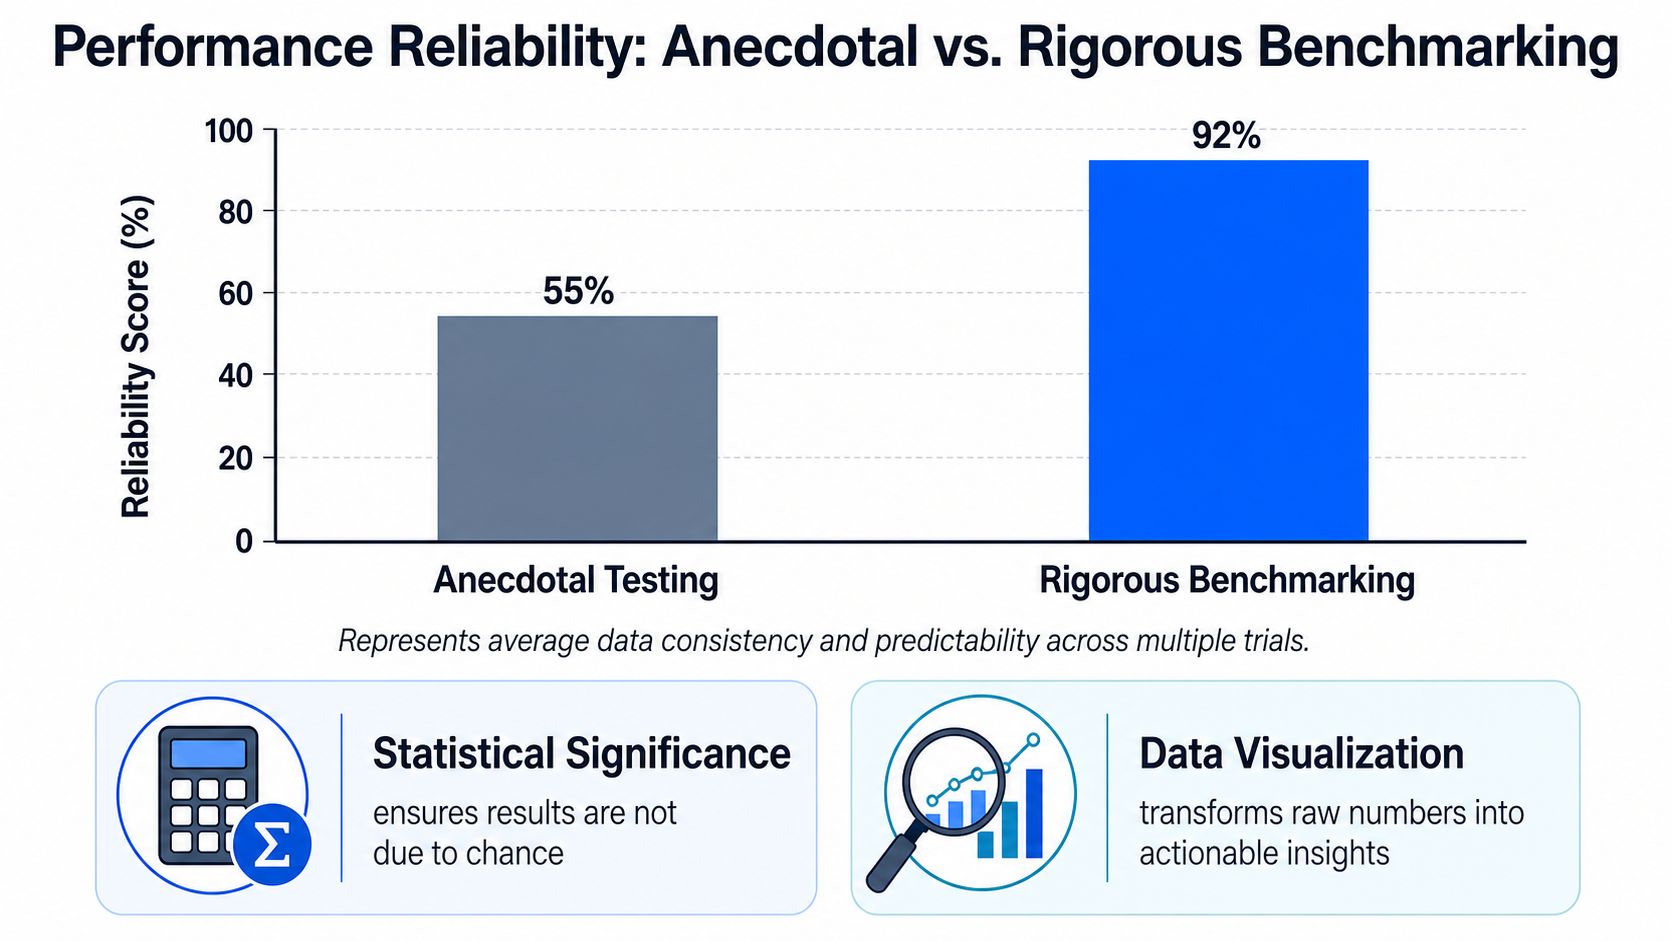
Execution is where many benchmark efforts become anecdotal. Someone runs a few tests, one chart looks promising, and the team starts talking as if the answer is settled. That approach is dangerous in procurement and even worse in R&D, where a weak conclusion can redirect months of lab effort.
Run enough iterations to trust the result
For benchmark rigor, the testing discipline matters as much as the metric. Guidance from RadView's benchmark testing methodology states that you need a minimum of 5 iterations under identical conditions, and 10+ iterations for high-stakes decisions. The same guidance says that if the coefficient of variation exceeds 5%, the environment is unstable and you should discard the conclusion rather than infer from noisy data.
That standard is useful beyond software. In a materials benchmark, repeated runs help expose instability in assay conditions, operator handling, preprocessing logic, or feature generation. If a model looks strong only on a single favorable run, the benchmark has measured luck.
Use a simple execution checklist:
- Lock the environment. Freeze data snapshot, feature logic, model version, and experimental protocol before the run starts.
- Repeat under identical conditions. Don't change preprocessing rules or manual exclusions between runs.
- Track variation explicitly. Coefficient of variation is one of the fastest ways to spot instability.
- Escalate the math when stakes are high. The same methodology recommends t-tests or 95% confidence interval analysis for controlled validation against claimed results.
A benchmark result you can't reproduce is a presentation asset, not a decision asset.
A useful comparison from another field is this case write-up on optimizing Hattafoodhub's app performance. The context is app performance, not materials science, but the operational lesson holds. Teams get better conclusions when they move from vague “it feels faster” judgments to structured testing and interpretation.
Turn analysis into a decision document
Charts matter, but only if they answer the right questions. For materials and AI benchmarks, the most effective visuals usually show one of three things:
- Consistency across repeated runs
- Performance split by chemistry family or process condition
- Error patterns in the experiments that matter most
That analysis should end in a written decision record, not only a slide. Document what was tested, what baseline was used, where the result was stable, where it broke, and what the team will do next. This protects the organization from benchmark amnesia, where a polished chart survives but the test assumptions disappear.
When the benchmark fails, that's also useful. A failed benchmark can reveal that your metadata structure is weak, your control workflow isn't well defined, or your model is overfitting to one region of the design space. Those are operational findings, not dead ends.
Common Pitfalls and How to Avoid Them
The most damaging benchmark failures aren't usually statistical errors in the final chart. They happen earlier, when teams accept the wrong assumptions and build the process on top of them.
The failures that distort benchmark results
One common problem is trusting external claims too quickly. In practice, vendor benchmarks often inflate performance by 20% or more, according to this analysis of software benchmark claims. In materials R&D, that distortion becomes more serious because a misleading benchmark can trigger poor experiment choices, tool selection mistakes, or overconfidence in black-box recommendations.
The same source notes that Polymerize customers have reported up to 50% fewer failed experiments by using explainable AI with validated confidence scores instead of unverified claims. The important lesson isn't the product reference. It's the benchmark principle. A model should be judged on whether it reduces failed experimental effort, not just whether it posts an attractive headline metric.

Other recurring pitfalls show up inside the team:
- Cherry-picking favorable runs. Someone keeps the best result and ignores unstable repeats.
- Mixing incompatible datasets. Historical records from different test methods get merged as if they were directly comparable.
- Benchmarking the model without benchmarking the workflow. The algorithm improves, but the lab handoff stays slow and error-prone.
- Ignoring uncertainty. A point prediction looks clean, yet nobody checks whether confidence was justified.
If the benchmark rewards only the fastest or highest-scoring output, people will optimize for appearance instead of decision quality.
The safeguards that keep teams honest
Strong teams build friction into the process. They require pre-registered metrics, fixed inclusion rules, and written rejection criteria before results are visible. That sounds bureaucratic, but it prevents informal edits after the team sees an outcome it likes.
A practical safeguard stack looks like this:
- Before the run. Freeze definitions, baseline choice, and acceptance thresholds.
- During the run. Log every exclusion, rerun, and preprocessing change.
- After the run. Review error cases with scientists, not only with data teams.
- Before adoption. Test whether the result survives under realistic lab variation and adjacent chemistry spaces.
The final safeguard is explainability with precedent. In materials R&D, scientists need to know why a recommendation appeared, what historical cases support it, and where uncertainty is high. When a benchmark includes that layer, adoption improves because the team can challenge the result scientifically rather than treat it as a black box.
Conclusion Integrating Benchmarking into Your R&D Workflow
Performance benchmarking works best when it stops being an isolated project and becomes part of how R&D makes decisions. Teams that do this well don't wait for a major procurement cycle or a troubled model launch. They benchmark continuously at the points where risk accumulates: new model deployment, workflow redesign, formulation screening, and handoff from lab to scale-up.
Build benchmarking into operating rhythm
The shift is cultural as much as technical. Scientists, data teams, and R&D leaders need one shared habit: every important comparison should have a baseline, a controlled test design, and a documented interpretation standard.
That doesn't mean every benchmark must be heavy. Some can be lightweight and operational. Others should be formal because the downstream decision is expensive. The key is consistency. If one model is tested with disciplined repetition and another is accepted from a vendor slide, the organization isn't benchmarking. It's improvising.
A durable benchmarking workflow usually includes:
- A benchmark registry that records objective, baseline, data scope, owner, and acceptance rule
- Standard templates for test matrices, run logs, and decision memos
- Periodic review by both scientific and digital leaders
- Automation where possible, especially for data extraction, version tracking, and repeat analysis
Tie benchmark results to real R&D choices
A benchmark should change what the organization does next. It should influence whether a platform gets expanded, whether a model is retrained, whether a formulation family moves forward, or whether a scale-up path needs more evidence.
That's the essential value. Good performance benchmarking shortens debate, exposes hidden process weaknesses, and prevents teams from mistaking polished outputs for reliable guidance. In materials science, that discipline matters more because every weak conclusion compounds in the lab.
When benchmarking becomes part of the workflow, R&D stops relying on scattered intuition and isolated pilot wins. The organization starts learning systematically from its own history, comparing new methods fairly, and making faster decisions with clearer scientific confidence.
If your team is trying to benchmark AI, formulations, or end-to-end materials workflows with more rigor, Polymerize is built for that reality. It helps unify fragmented R&D data, supports explainable model outputs with confidence and historical precedent, and gives materials organizations a stronger foundation for deciding what to test next.
Put your R&D data to work
See how materials teams use Polymerize to plan fewer experiments and reach target properties faster.