



A formulation model flags a polymer blend as the next promising candidate. The predicted property looks strong, yet the team hesitates. Which ingredients drove the result? Did the model learn a real materials relationship, or did it rely on a batch identifier, a measurement artifact, or a narrow region of historical data? Without a defensible explanation, the recommendation may never leave the screen.
This is the practical challenge of interpretable machine learning in materials R&D. A useful model must do more than rank formulations. It should help scientists understand the drivers, recognize uncertainty, challenge implausible recommendations, and decide which experiment to run next. That standard matters when experiments consume scarce material, scale-up exposes hidden process effects, and formulation knowledge represents valuable intellectual property.
Table of Contents
Why Interpretable Machine Learning Matters in the Lab
A black-box prediction can be accurate and still be scientifically unhelpful. Suppose a model predicts that a coating formulation will meet a target balance of adhesion and flexibility. The formulation chemist needs more than the predicted values. They need to know whether the recommendation reflects resin chemistry, additive loading, cure conditions, molecular descriptors, or a confounding feature inherited from a particular production campaign.
The distinction is important because prediction and understanding serve different purposes. A prediction answers, “What might happen?” An interpretable model or explanation helps answer, “Why does the system expect this result, and what could we change?” Those questions become inseparable when a team must approve an experiment, explain a result to a process engineer, or defend a design choice during a technical review.

Trust has a laboratory context
Materials scientists already use forms of interpretability. A regression equation exposes coefficients. A design-of-experiments model shows factor effects. A mechanistic hypothesis connects processing conditions to morphology and performance. Machine learning becomes easier to adopt when it supports these existing habits instead of presenting a recommendation with no scientific trail.
Interpretability also protects against attractive but misleading patterns. A model may associate a property with a supplier code because that code tracks a hidden change in raw-material quality. It may treat test temperature as a dominant driver because different teams used different protocols. An explanation can surface such dependencies, but the scientist still has to test whether they make physical and operational sense.
Practical rule: Treat an explanation as a reason to investigate, not as proof of a mechanism.
The field has a long history. Interpretable machine learning draws on regression modeling and rule-based approaches with roots extending back more than 200 years, while its modern expansion accelerated as deep learning entered high-stakes applications. Historical reviews distinguish interpretable models from post hoc explanation methods, a distinction that became central as organizations deployed opaque systems where auditability mattered (historical survey of interpretable machine learning).
For an R&D team, the desired outcome is therefore practical: connect model behavior to formulation science, identify the next informative experiment, and preserve a reviewable path from data to decision.
Understanding the Core Concepts and Taxonomy
A materials scientist reviewing a promising formulation needs more than a prediction. The practical questions are, can the model be understood by construction, or must it be explained after training? And what kind of understanding will guide the next experiment? These questions prevent the common mistake of treating every explainability method as interchangeable.
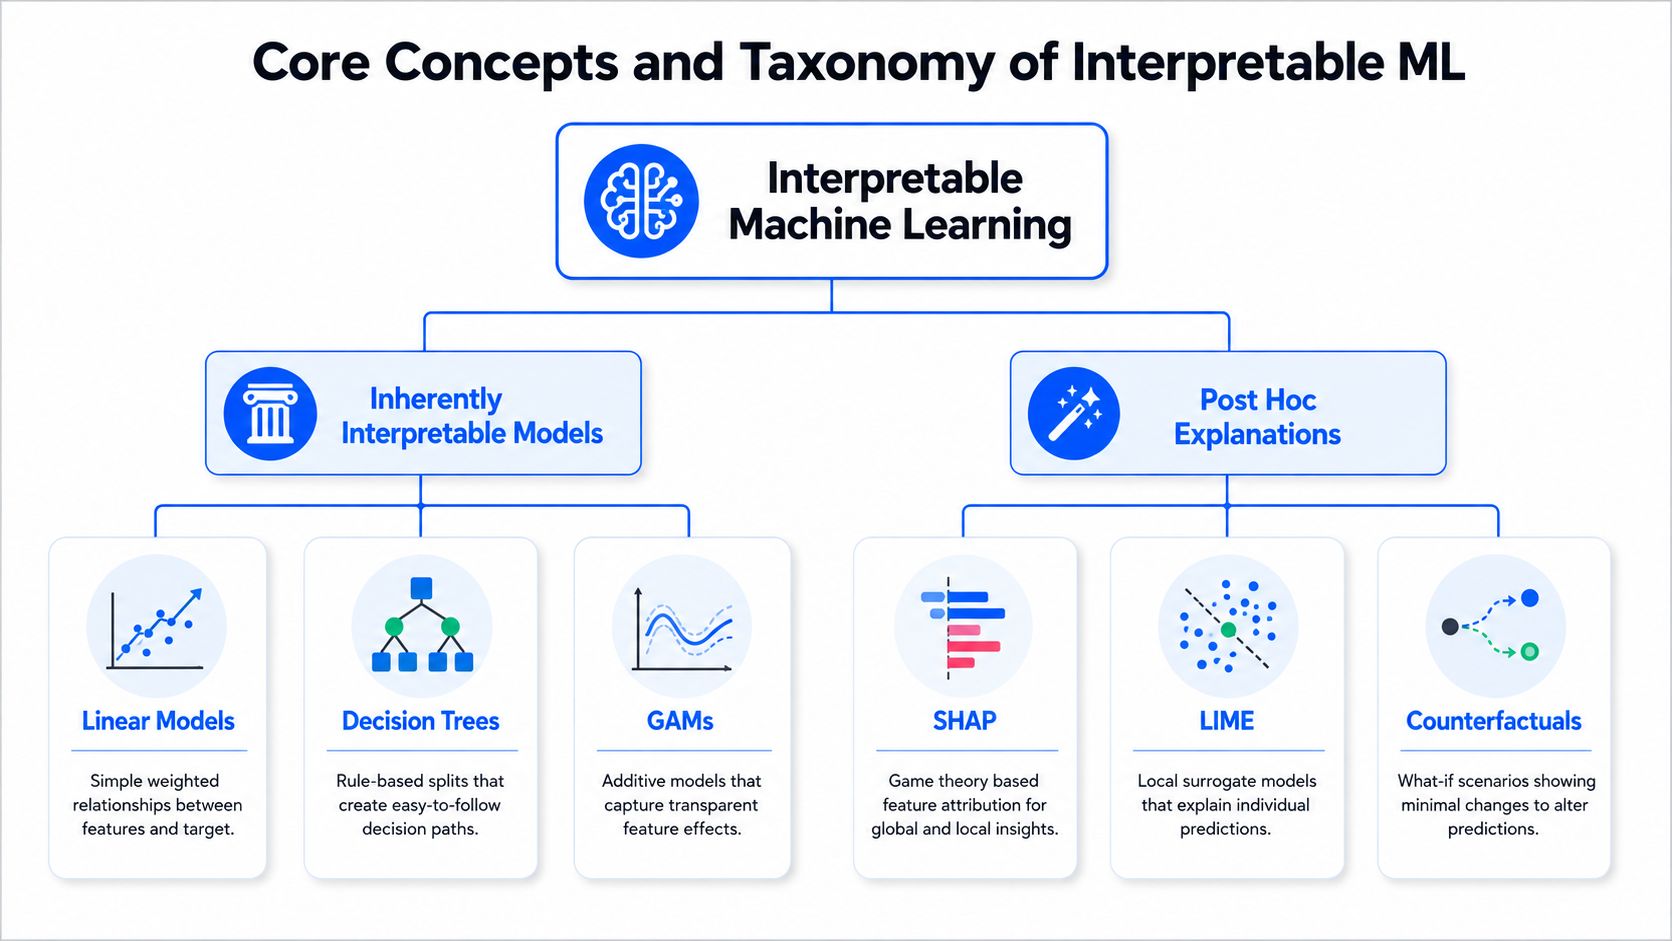
An interpretable model works like a transparent recipe. A linear model exposes weighted relationships between inputs and an output. A decision tree displays a sequence of rules. A generalized additive model shows how separate features contribute through visible, often smooth functions. The model structure supplies the explanation, although it can still be wrong, incomplete, or difficult to read when inputs interact heavily.
A post hoc method works more like a taste test. The original model remains complex, while a separate technique estimates why it produced a particular result. SHAP can attribute one prediction across features, LIME can fit a local approximation around one input, and a counterfactual can describe a change that might alter the outcome. Such outputs are useful evidence, not a direct window into the model's internal reasoning. For R&D, their value depends on whether they point to a feasible experiment and reduce uncertainty about what to try next.
Three dimensions make the taxonomy useful
A major survey of neural-network interpretability organizes explanations across three dimensions: the type of engagement, the type of explanation, and the focus from local to global interpretability (survey of interpretable machine learning methods). Together, they form a user-centered map.
- Engagement describes how the scientist works with the model. They may inspect a completed prediction, probe the model by changing inputs, or use interpretability while developing the model.
- Explanation type describes the evidence provided. It may be a feature attribution, rule, example, visualization, or counterfactual scenario.
- Scope separates local from global understanding. Local interpretation explains one formulation or prediction. Global interpretation describes behavior across a dataset, such as a nonlinear effect or interaction pattern.
The distinction affects laboratory decisions. A formulation review may need a local explanation for one candidate, while a platform owner may need a global view across resin families, process windows, and measurement protocols. Neither view alone establishes a mechanism. A useful explanation connects model behavior with a testable material or process change.
The field is broader than feature importance
A foundational survey organizes interpretable machine learning into 10 major technical challenge areas, including sparse logical models, scoring systems, constrained generalized additive models, case-based reasoning, disentanglement, dimensionality reduction, physics and causal constraints, the Rashomon set of good models, and interpretable reinforcement learning. The range shows why one attribution chart cannot represent the whole field.
Interpretability matters when a model supports safety-relevant properties, process changes, qualification evidence, or recommendations that influence production. The appropriate method depends on the decision, the data, and the scientific question. Explanations should be judged by actionability: do they help the team reject a misleading pattern, select a feasible next experiment, and preserve a reviewable path from prediction to decision?
Key Techniques Every Materials Team Should Know
The best technique depends on the question, not on the popularity of the method. A scientist asking which ingredient drives viscosity needs a different answer from a scientist asking what minimal formulation change could move a prediction above a release threshold.
| Technique | Question It Answers | Scope | Best Use in Materials R&D |
|---|---|---|---|
| Feature importance | Which variables influence predictions most broadly? | Usually global | Screening descriptors, ingredients, and process variables across a portfolio |
| Surrogate model | Can a simpler model approximate the complex model? | Global or local | Explaining a complex property predictor to a review team |
| SHAP | How did features contribute to this specific prediction, and across predictions? | Local and global | Reviewing candidate formulations and comparing driver patterns |
| LIME | Which local relationships approximate the model around this input? | Local | Inspecting one formulation or a small neighborhood |
| Counterfactual explanation | What would need to change to alter the prediction? | Local | Designing a feasible formulation adjustment or next experiment |
| Causal methods | What intervention is likely to change the outcome? | Depends on design and assumptions | Separating actionable drivers from correlations in process and formulation data |
Start with the question behind the chart
Feature importance offers a useful first screen, but it can hide direction and context. Knowing that a descriptor matters doesn't tell you whether increasing it improves the target, whether the effect changes across a composition range, or whether it only matters because it proxies for another variable.
Surrogate models make a complex predictor easier to inspect by approximating it with a simpler structure. They can support communication, but approximation quality must be checked. A simple model that looks convincing in one region may misrepresent behavior elsewhere.
SHAP and LIME focus more directly on individual predictions. SHAP explanations can help a chemist see which inputs pushed a candidate toward or away from a target. LIME can provide a local approximation, but its result depends on how the neighborhood is sampled and represented. Neither method removes the need to examine data quality or chemical plausibility.
Counterfactuals are often closer to experimental planning. Instead of saying that additive loading mattered, a counterfactual asks what change could shift the predicted outcome. The proposed change still needs constraints: availability, compatibility, manufacturability, safety, and the experimental design space.
Causal methods address the hardest question, whether changing a variable would change the property. Observational formulation data rarely answer that question by themselves. Process knowledge, controlled experiments, confounder handling, and explicit assumptions remain essential.
The strongest explanation isn't always the most detailed one. It's the one that helps the scientist choose a feasible action and understand its limits.
How to Evaluate Trust and Explanation Quality
A scientist may reject a promising formulation because an explanation highlights a familiar ingredient for the wrong reason. A persuasive chart can still misrepresent the model's decision process. Faithfulness tests whether an explanation tracks what the model relies on, rather than what looks chemically reasonable.
Recent evaluation benchmarks define measurable faithfulness criteria, including Faithfulness Correlation, Faithfulness Estimate, Pixel Flipping, Region Perturbation, Insertion, and Deletion (benchmark for explanation faithfulness metrics). Faithfulness Correlation, for example, compares changes in model logits after feature replacement with the explanation score assigned to those features. For materials R&D, replace or perturb formulation variables, then check whether the predicted response changes in the direction and magnitude indicated by the explanation.

Four checks for an explanation audit
Use several checks because no single score captures scientific usefulness.
- Faithfulness: Changing the highlighted feature should produce the model response predicted by the explanation.
- Consistency: Similar formulations should receive broadly similar explanations. Large changes for near-duplicates signal a problem.
- Plausibility: The explanation should align with domain knowledge and known measurement constraints.
- Stability: A small, irrelevant input perturbation should leave the explanation reasonably stable.
The final two checks support review, but faithfulness remains the key test. Domain knowledge can make an incorrect explanation appear safe, while stability can preserve a consistently misleading pattern. For experimental planning, the practical question is whether the explanation helps select a feasible next experiment and reduces avoidable failures.
A comparative study found that sufficiency and coverage-of-removal had higher diagnosticity and lower computational complexity than other common interpretability metrics, making them practical candidates for production validation when explanation compute and latency matter (comparative study of interpretability metrics). Sufficiency measures whether selected features retain enough information to produce the prediction. Coverage-of-removal measures how much the prediction changes when those features are removed.
Validate before you operationalize
Build explanation checks into model review rather than adding them after deployment. Test representative formulation families, edge cases, missing-data patterns, and known process shifts. Ask scientists to challenge explanations with counterexamples, then record whether the model or the explanation needs revision.
Teams designing broader validation programs may also benefit from a practical guide to how to evaluate AI models end-to-end, particularly when explanation checks must sit alongside data, performance, monitoring, and governance controls.
Navigating Tradeoffs Between Accuracy Interpretability and Cost
Interpretability isn't free, and a simpler model isn't automatically the right model. A 2026 evaluation of interpretable models reports that systematic comparisons remain scarce, classification performance has no stable hierarchy across datasets, and sparsity-oriented approaches can require significantly longer training times, an effect described as an “interpretability tax” (study of interpretable model tradeoffs).
The implication for tabular industrial data is straightforward: don't choose a model by ideology. Compare candidates on predictive performance, explanation quality, training burden, inference needs, maintenance, and scientific value for the task.
Use a dataset-aware decision frame
A transparent model may be a strong choice when the relationship is reasonably simple, the feature set is controlled, and the team needs direct inspection. A more complex model may earn its place when interactions or nonlinearities capture important behavior. In that case, post hoc explanations require rigorous faithfulness tests and clear operating boundaries.
The more useful question is not “Which model is most interpretable?” It is “Which model provides enough predictive value and trustworthy insight at an acceptable workflow cost?” That answer can differ between property prediction, formulation optimization, anomaly detection, and scale-up risk assessment.
For materials teams, add one final criterion: actionability. A model that explains a result but recommends an impossible ingredient substitution has limited value. A slightly less transparent model may be more useful if its explanations reliably guide feasible experiments, expose uncertainty, and support scientific review.
Choose the model that improves the decision process, not the model that produces the prettiest explanation.
Putting Interpretable Machine Learning Into Practice for Materials R&D
A formulation team may receive a promising prediction on Monday, run the suggested experiment on Tuesday, and discover that the recommendation ignored a batch-history difference. The problem is not only model accuracy. The team needs a workflow that connects evidence, explanation, experimental action, and the result that follows.
Adoption starts with a dependable record of formulations, raw materials, process conditions, test methods, results, and provenance. Fragmented spreadsheets and ELN records can mix incompatible measurements or remove the context needed to interpret a feature.
Create a reviewable data-to-decision loop
A practical implementation can follow this sequence:
- Unify the evidence. Standardize units, names, test conditions, batch context, and links to source records. Preserve historical precedents instead of flattening them into anonymous rows.
- Define the decision. State whether the model will rank candidates, identify drivers, suggest formulation changes, flag scale-up risk, or select the next experiment.
- Train and compare models. Include an interpretable baseline and, where appropriate, a more flexible candidate. Compare scientific usefulness alongside predictive behavior.
- Attach explanations to experiments. Store feature contributions, confidence information, applicable data ranges, and the scientist's acceptance or rejection rationale with the proposed run.
- Close the loop. Feed the new result into the data backbone. Review whether the explanation helped, misled, or exposed a missing variable.
The fourth step makes explainability operational. Recording that a model highlighted an ingredient is insufficient. Scientists should also record whether the insight changed the experiment and whether the result supported the proposed reasoning.
Design experiments for learning, not only confirmation
An explanation earns practical value when it suggests a discriminating experiment. If two hypotheses predict different effects from a process change, prioritize the experiment that separates them while staying within safety and manufacturing constraints. Confidence scores can distinguish a well-supported recommendation from one requiring more evidence, but experimental judgment remains necessary.
For organizations evaluating platforms, Polymerize provides a materials R&D environment that unifies experimental data and offers domain-specific explainable models for property prediction and formulation optimization. Its stated capabilities include feature attribution, causal pathway analysis, confidence scoring, and historical precedents. These functions can support reviewable recommendations and next-experiment planning. The product information is available from Polymerize.
The practical test is actionability: does the explanation reduce blind iterations, sharpen technical review, preserve institutional knowledge, and guide a feasible next experiment? A useful model connects its output to laboratory action, including the constraints and uncertainty that shape the decision.
Building Trustworthy AI for Scale Regulation and IP Protection
A model may recommend a promising formulation, yet scaling it can expose missing records, unclear permissions, or untested assumptions. Trustworthy deployment therefore connects interpretability with access control, data provenance, validation records, and accountable human review. The AI governance guide for 2026 offers a broader reference for policies, oversight, and compliance planning.
IP protection begins with controlling who can see which materials data and experiments. Teams need role-based access, secure data handling, controlled experiment visibility, and records showing how recommendations were reviewed. ISO 27001, SOC 2, and GDPR or CCPA alignment can support this operating environment when paired with clear internal policies.
Before scaling a system, leaders should ask:
- Evidence: Can scientists trace each recommendation to the relevant data and experiment context?
- Boundaries: Can they identify reliable use cases and extrapolation?
- Action: Does the explanation change experiment selection, or merely describe a prediction?
- Ownership: Who approves, overrides, monitors, and retires the model?
These questions shift interpretability from a static feature ranking to a decision test. An explanation earns trust when it helps a team choose a feasible next experiment, reduce failed iterations, and preserve the reasoning behind that choice. Polymerize is one example of a materials R&D environment that connects experimental data with explainable predictions, formulation decisions, confidence, and historical evidence. Teams should assess such tools by whether their recommendations remain reviewable under regulatory and IP constraints.
Put your R&D data to work
See how materials teams use Polymerize to plan fewer experiments and reach target properties faster.