

How to Implement Quality Control in Materials R&D Labs
A formulation team discovers viscosity drift after a pilot batch fails scale-up. The lab records look complete, the release tests were performed, and the final result is clearly out of range. The problem is that the process shifted weeks earlier, while the team was still producing results that looked acceptable one experiment at a time.
That situation is common in materials R&D. Quality control often starts as a final inspection routine, then grows into spreadsheets, checklists, dashboards, and disconnected corrective-action logs. The result is more documentation without earlier detection. To learn how to implement quality control effectively, treat QC as a live decision system that connects measurements, process conditions, equipment, people, and corrective action.
Table of Contents
- Confirm the measurement system first
- Build the baseline from normal production
- Close the loop when a chart signals
Why Quality Control in R&D Is Not Just Inspection
A release test tells you what happened to a batch. It doesn't necessarily tell you when the process began to move, which input caused the movement, or whether the next batch is exposed to the same risk. In a polymer formulation line, viscosity, cure temperature, mixing energy, moisture, and addition sequence can interact. Checking only the final viscosity may confirm failure without preventing it.
Modern quality control developed around this distinction. In the 1920s, Walter A. Shewhart introduced statistical sampling techniques and the control chart at Bell Labs, helping shift quality management from end-of-line inspection toward process-based control. Operators could identify abnormal variation during production instead of waiting for defective output, as described in this history of ISO 9001 and statistical quality control.
The operating model has changed
The same principle applies in a research laboratory, even when the output is an experimental batch rather than a mass-produced component. A control chart can show that a process is becoming unstable before a specification breach occurs. A governed data record can connect that signal to a formulation version, raw-material lot, instrument, operator, and processing condition.
The implementation journey is therefore broader than inspection:
- Assess the current state: Find where data, decisions, and failures sit.
- Define the risks: Select characteristics linked to customer requirements, safety, performance, or compliance.
- Measure consistently: Confirm that instruments and methods can distinguish process variation from measurement noise.
- Standardize execution: Make the approved method easy to follow at the bench and on the pilot line.
- Connect the data: Preserve traceability across spreadsheets, ELNs, LIMS, MES, ERP, and maintenance records.
- Predict selectively: Use historical experiments to identify likely failure conditions and useful next experiments.
- Improve continuously: Review signals, corrective actions, and outcomes, then refine the control plan.
The practical test is simple. If a quality signal appears, can the team explain what changed, who owns the response, and whether the response was effective? If the answer depends on searching through several spreadsheets or asking one experienced chemist to reconstruct the history, QC hasn't become a reliable operating system yet.
Assessing Your Current State and Defining QC Objectives
A batch can pass its final test while the team still cannot explain why it passed. Results may sit in an ELN, LIMS, legacy spreadsheet, instrument export, or paper notebook, with manual copies connecting them. Start by observing the work as it happens, alongside formulation chemists, analytical scientists, process engineers, technicians, and quality personnel. Ask where each result is first recorded, where it is copied, which record controls decisions, and what happens when records disagree.
Audit the points where quality breaks
Trace a batch from request through release. Record:
- Data location: Map spreadsheets, ELNs, LIMS, paper notebooks, instrument exports, shared folders, and email. Mark duplicate entry points and records that cannot exchange data.
- Critical characteristics: Separate measurements tied to customer performance, safety, or compliance from results collected only because the method makes them easy to obtain.
- Failure origin: Check raw materials, weighing, mixing, temperature control, sample preparation, instrument condition, and result interpretation.
- Decision timing: Identify when the team first sees drift and who can stop, adjust, or quarantine work.
- Economic effect: Capture scrap, rework, delayed release, repeat testing, lost pilot capacity, and investigation labor.
Include the human workflow in the audit. Resistance to change is a measurable adoption risk and has been reported as 59.2% of integration challenges. Find out who relies on workarounds, which steps operators distrust, and what information they fear losing. A technician copying values manually may be compensating for a missing interface. A chemist maintaining a private spreadsheet may be preserving context that the official system omits. The fix may be a data connection or a revised record design, not stricter enforcement.
Do not turn the audit into a search for blame. The purpose is to expose weak links and determine whether QC can connect to the lab's existing data backbone without creating another silo.
Convert observations into a small set of objectives
Choose two or three objectives for the first rollout. State outcomes the team can observe and act on, such as reducing out-of-specification rework, shortening investigations, improving traceability for critical tests, or detecting formulation drift earlier. Assign each objective an owner, source system, review cadence, threshold, and response.
The business case should use local losses wherever possible. The WorldMetrics quality control statistics summary estimates that poor quality costs U.S. manufacturers about 2.1% of sales revenue each year, as reported in this quality control statistics summary. Use that figure as context, then have finance and operations identify where quality costs occur in your facility.
Practical rule: Do not measure everything the system can capture. Measure what changes a decision.
“Improve quality” is not an operating requirement. “Detect a sustained viscosity shift before release testing and assign an investigation owner” is. Define success with the people who run the method. They can distinguish chemically meaningful variation from noise introduced by sampling or preparation.
Designing Test Methods, Sampling Plans, and Control Charts
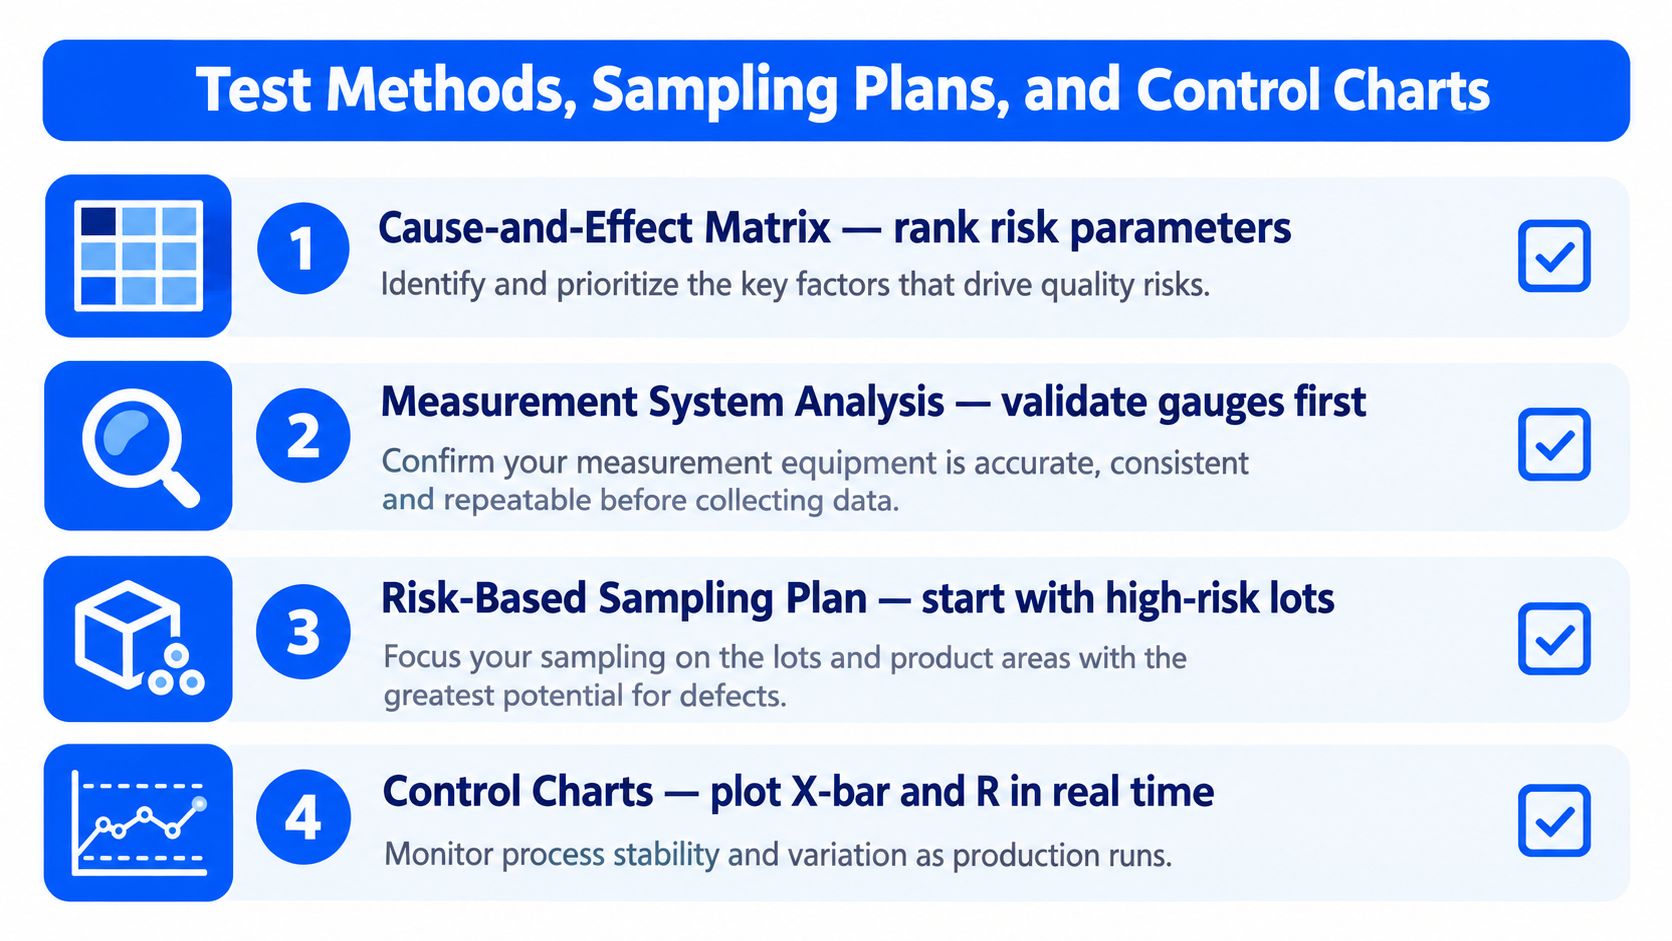
The technical design should begin with risk, not with the charting software. Build a cause-and-effect matrix that connects customer requirements and compliance obligations to formulation inputs, process conditions, test methods, and equipment. Rank the relationships, then start with the highest-risk variables rather than charting every available result.
For an early rollout, deploy initial control charts on only the top 3–5 variables, as recommended in this SPC implementation guidance for manufacturing. In a polymer batch, those variables might be viscosity, cure temperature, mixing temperature, solids content, and moisture, but the right selection depends on the failure modes your team has verified.
Confirm the measurement system first
A control chart can't separate process variation from measurement variation unless the measurement system is capable. Before setting baseline limits, check instrument calibration, method repeatability, sample homogeneity, operator technique, and environmental conditions. Use Gauge R&R where appropriate and target Gauge R&R of 10% or less before treating the measurement as a dependable control input, following the cited implementation sequence.
Suppose two analysts test the same polymer sample and produce materially different viscosity readings because temperature equilibration is inconsistent. A chart may signal repeatedly even though the batch is stable. Fix the method, not the process. Define sample conditioning, test temperature, spindle or fixture settings, preparation time, and acceptance rules in the method document.
Build the baseline from normal production
Define the subgroup structure and sampling frequency before collecting data. Then collect 20–25 subgroups under normal production conditions and calculate upper and lower control limits from the observed process data, not from engineering specification limits, according to the same SPC guidance.
For the formulation example, a subgroup could contain viscosity results from samples taken at a defined stage of mixing, with cure temperature recorded for the corresponding run. If the baseline includes a known dosing error, an instrument fault, or an unusual maintenance event, remove that special-cause subgroup from the baseline and investigate it separately. Don't hide special causes in the limits, because doing so teaches the system that abnormal behavior is normal.
Use specification limits for customer or compliance decisions. Use process control limits for detecting unusual behavior within the process. Those are different questions, and combining them creates false alarms or missed signals.
Close the loop when a chart signals
A signal should trigger a defined response, not a debate about whether the chart is “right.” The control plan should state who reviews the result, what immediate containment is required, which records must be checked, and what evidence closes the action.
For example, a viscosity signal might prompt a hold on the batch, a review of temperature history and addition sequence, confirmation of instrument status, and a check of raw-material lots. The team can then classify the cause, document the decision, and determine whether the process needs adjustment, retraining, maintenance, or a revised control limit.
Standardizing SOPs, Equipment, and Your Data Backbone
A control chart is only as trustworthy as the work behind each point. If technicians use different sample conditioning times, analysts select different instrument methods, or operators record batch identifiers inconsistently, the chart becomes a mixture of processes rather than a view of one process.
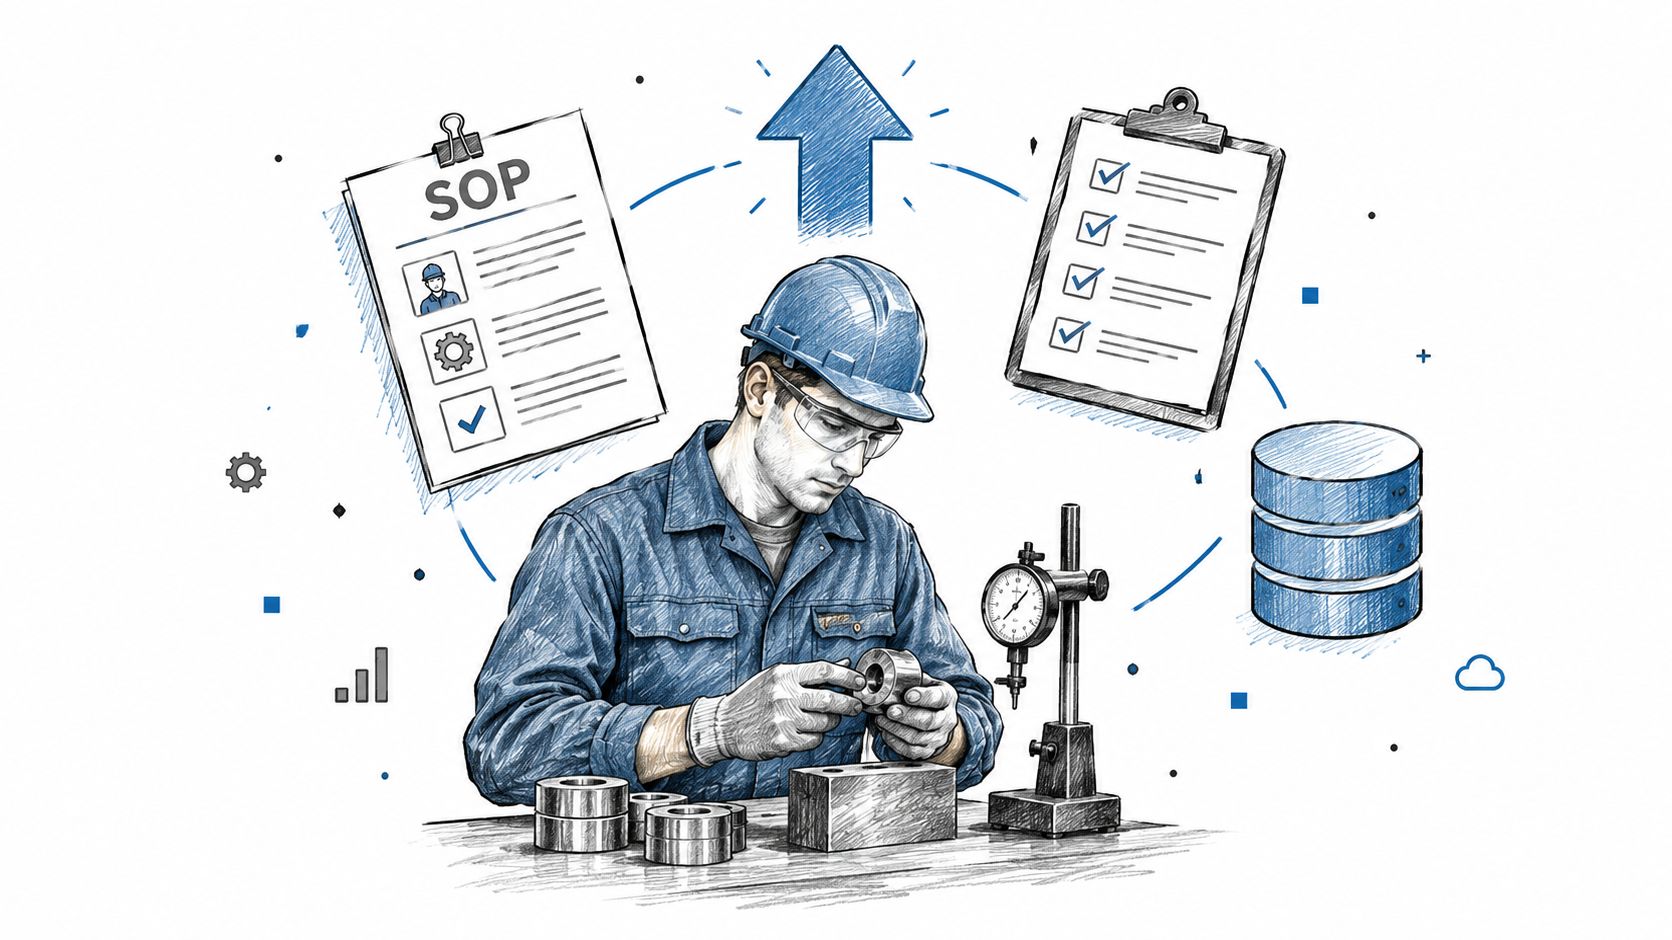
Write SOPs for execution, not for decoration. Each document should identify the approved method version, critical settings, safety controls, required records, deviation handling, and escalation path. Keep the instruction close to the task, use clear decision points, and retire obsolete versions so the operator doesn't have to guess which document applies. Teams that need help turning procedures into practical visual support can use these job aids for SOPs design.
Treat equipment and records as one control layer
Equipment qualification and calibration should connect directly to the control plan. Record the instrument identity, method version, calibration status, maintenance events, analyst, sample identity, and result. If a result is later challenged, the team should be able to reconstruct the conditions without relying on personal memory.
The data backbone needs the same discipline. An ELN or LIMS can provide structured capture, but it won't solve the problem if it creates another isolated repository. Map the required links between formulation data, test results, raw-material lots, equipment, work orders, maintenance records, and release decisions. Then check whether the system can exchange those records with ERP, MES, CMMS, instruments, and legacy spreadsheets.
Avoid the new silo
A modern QC application that cannot integrate with the laboratory's existing systems often forces manual re-entry. That creates transcription risk, weakens traceability, and makes adoption harder because staff must maintain parallel records. Recent discussion of QC implementation highlights integration with ERP, MES, CMMS, and legacy environments as a practical blocker, not a secondary IT detail, in this analysis of interoperability in quality control.
Choose infrastructure using concrete criteria:
- Identity: Every result links to a batch, formulation, sample, method, instrument, and operator.
- Lineage: Users can see changes, approvals, superseded versions, and audit history.
- Interoperability: The system can receive and return structured data without forcing duplicate entry.
- Governance: Role-based permissions protect sensitive formulations while allowing the right people to act.
- Resilience: The process remains usable when an instrument, interface, or legacy source is temporarily unavailable.
The aim isn't to eliminate every spreadsheet immediately. It's to define which records are authoritative, how transitional sources are controlled, and how the organization will retire manual workarounds without losing valuable historical context.
Adding AI-Driven Predictive Quality Control
Reactive QC asks whether the current result is acceptable. Predictive QC asks whether the planned experiment or batch resembles conditions that previously led to failure, drift, or an unexpected outcome. That distinction matters in formulation work, where a failed experiment consumes material, instrument capacity, and scientist attention before the team learns what went wrong.
Once experimental data is structured, a model can examine formulation composition, process conditions, test results, and outcomes together. It may flag a proposed formulation as risky, identify a likely interaction between variables, or recommend a next experiment that separates competing explanations. The useful output isn't a mysterious pass or fail. It's a reasoned warning with confidence, relevant historical precedents, and the variables that influenced the prediction.
Start with imperfect but governed data
Don't wait for a perfect historical archive. Begin with a defined domain, consistent identifiers, and enough context to distinguish a formulation from a result. Historical data can be incomplete, but the team should label missing values, method changes, outliers, and changes in raw-material source rather than presenting them as equivalent observations.
A model trained on inconsistent units, undocumented test changes, or copied values will reproduce those weaknesses. Garbage in produces confident garbage out. Data governance therefore matters more than an attractive interface. The model needs access to the same controlled definitions that support SPC, including formulation versions, process stages, and measurement conditions.
Keep the model subordinate to process control
Predictive models supplement SPC and operator judgment. They don't replace control charts, validated methods, or a qualified investigation process. A model can identify a risk that deserves attention, but the process owner still decides whether to adjust a formulation, repeat a test, quarantine material, or run a confirming experiment.
Set practical acceptance criteria for each predictive use case:
- Explainability: Show which variables contributed to the prediction.
- Confidence: Distinguish a strong signal from a prediction made in an unfamiliar region of the data.
- Precedent: Let scientists inspect comparable historical experiments.
- Actionability: Connect the prediction to a specific next test or process review.
- Feedback: Record whether the warning was correct and use that outcome to improve the model.
The first useful outcome may be a better experiment decision, not an autonomous release decision. That is the right level of ambition for a lab moving from disconnected records to predictive quality.
Piloting, Training Teams, and Managing the Human Side
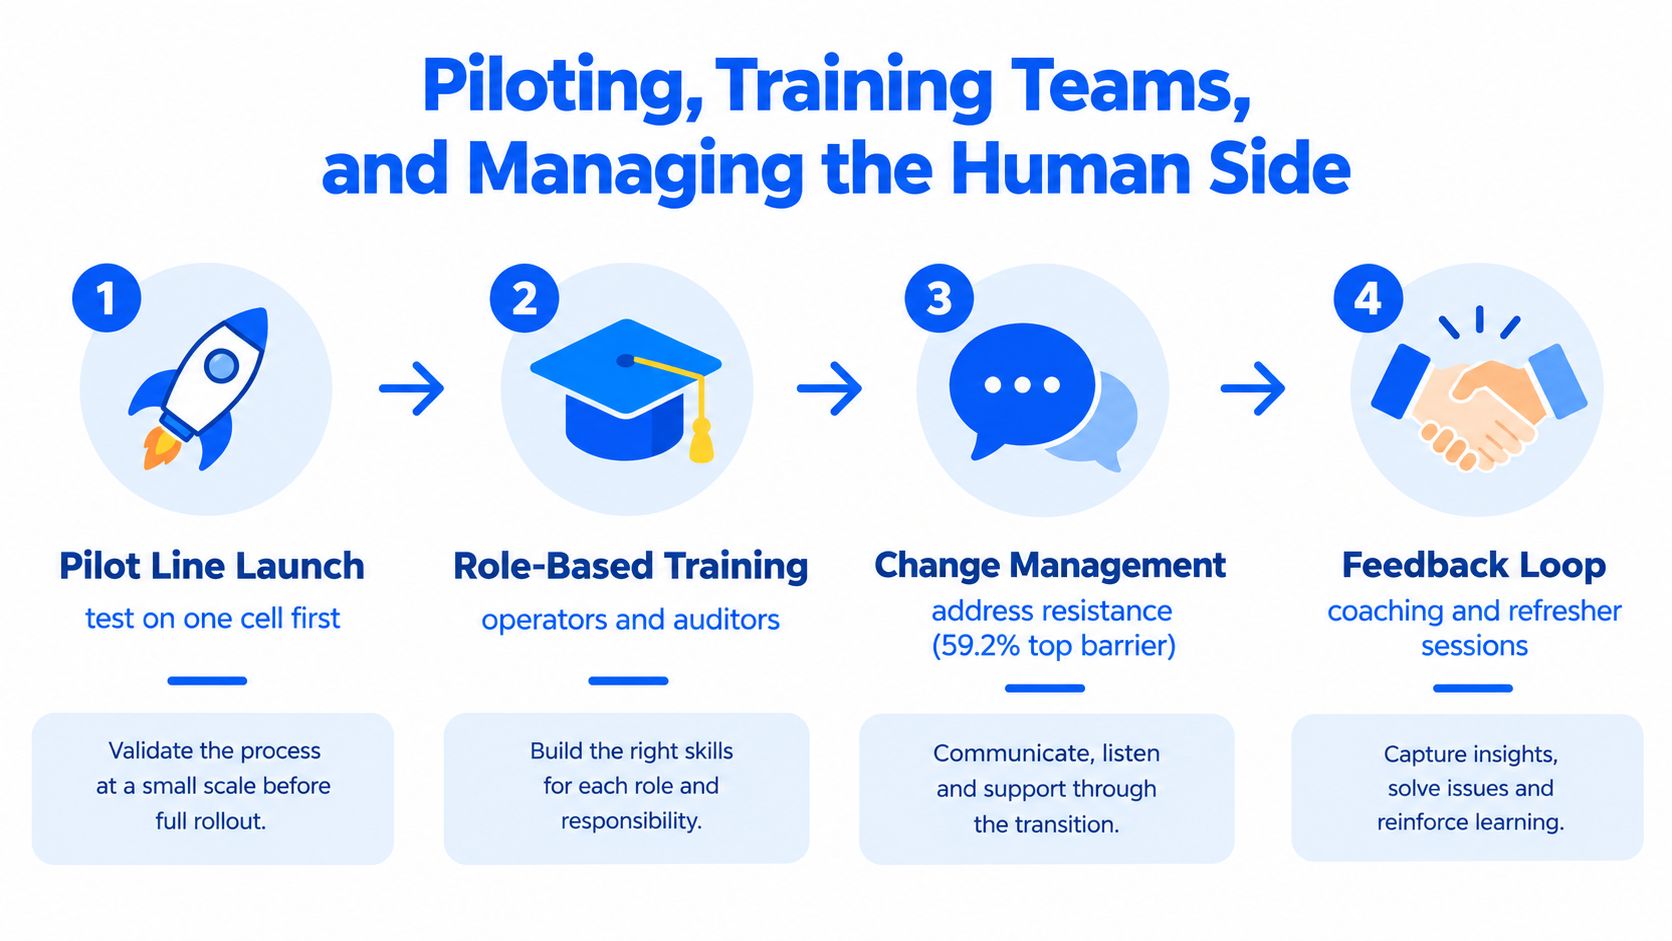
A technically correct QC system can still fail if people experience it as extra work with delayed benefits. Evidence in the provided implementation research identifies resistance to change as the dominant integration challenge at 59.2%, compared with 22.8% for communication issues, as reported in this study of quality implementation barriers. That makes adoption a design constraint, not a training footnote.
Run the first pilot on one product line, one lab workflow, or one pilot cell. Give the team a narrow control plan, a named process owner, clear escalation rules, and success criteria that reflect both quality and usability. If technicians must enter the same information in three places, the pilot is testing administrative tolerance rather than QC.
Build habits around real work
Train people by role and by decision. An operator needs to know how to collect a valid sample, interpret a signal, and escalate it. An analyst needs to understand method controls and data review. An engineer needs to investigate causes. A manager needs to remove barriers and respond consistently when the chart signals.
Ask operators to review chart variables, sampling frequency, and response instructions before launch. They can identify steps that look reasonable in a meeting but fail beside a mixer, oven, or rheometer. When an early signal prevents a failed batch or exposes a problem before release, make that result visible. Recognition helps the team connect the new routine with a practical benefit.
Leadership behavior matters more than launch messaging. If managers bypass the approved workflow when schedules tighten, staff will learn that QC is optional. If leaders review signals, protect investigation time, and close corrective actions, the process gains credibility.
Scale what must be common
Centralize definitions, critical methods, data identifiers, audit requirements, and escalation logic. Leave room for local differences in equipment, staffing, sample handling, and regulatory context where those differences don't weaken the control objective.
Watch for warning signs during the pilot:
- Workarounds return: Staff keep private records because the official workflow is slow or incomplete.
- Signals are ignored: Charts show abnormalities without an assigned owner or response.
- Training decays: New staff learn from informal habits instead of the approved method.
- Data quality falls: Required fields are left blank, units vary, or batch identifiers stop matching.
- Reviews disappear: Managers stop discussing quality signals once the initial launch ends.
Monitoring KPIs and Driving Continuous Improvement
Go-live starts the measurement cycle. The first review should connect process behavior with business consequences, using a compact KPI set rather than a crowded dashboard. Track defects per unit, scrap and rework cost, cycle time, detection speed, investigation closure, and first-pass yield.
Compare products, lines, shifts, and sites internally before looking outward. Internal benchmarking exposes local variation and gives teams a practical baseline for action. The quality assurance guidance on benchmarking and SPC identifies cost per unit, productivity per unit, cycle time, and defects per unit as useful inputs for gap analysis and standardized planning.
Track outcomes, not dashboard activity
A record of completed inspections can look healthy while defects, delays, and repeat work continue. Pair activity measures with outcomes that show whether the control plan is changing performance:
| KPI | What it reveals | Management response |
|---|---|---|
| Defects per unit | Whether process performance is improving | Investigate recurring defect families |
| Scrap and rework cost | The financial effect of quality losses | Prioritize causes with the largest operational impact |
| Cycle time | Whether QC creates delay or removes delay | Remove duplicate approvals and repeated testing |
| Detection speed | How quickly the team identifies drift | Move sampling closer to the process change |
| First-pass yield | Whether work meets requirements without repetition | Review method, material, and execution causes |
The guida ai 13 KPI qualità offers a broader vocabulary for building a scorecard. Select measures that a named owner can influence. Otherwise, the KPI becomes reporting overhead.
Use signals to improve the control plan
Each meaningful signal should lead to a documented cause, a justified continuation supported by evidence, or an unresolved risk with a defined follow-up. Review whether sampling detected the issue early enough, whether the test method could distinguish acceptable from unacceptable material, and whether the assigned response reached closure.
Use SPC to identify checks that consume capacity without adding control. If the process remains stable and the risk assessment supports a change, reduce redundant testing cautiously, record the rationale, and monitor the result. A new raw-material source, equipment change, or formulation revision may require intensified monitoring and a new baseline.
Inspection alone can leave important defects undetected, while statistical control gives the team an earlier view of process movement. The cited quality control statistics source reports visual inspection catching 88% of soldering defects before SPC implementation and 98% after SPC was added. Treat that comparison as an illustration of the value of process monitoring, not as a performance guarantee for every laboratory or pilot line.
The data backbone determines whether these reviews lead to action. Connect KPI records to the authoritative batch or experiment record across the ELN, LIMS, and legacy spreadsheets. Do not create another isolated dashboard. Reconcile identifiers, units, timestamps, and method versions first, then assign ownership for exceptions. Adoption also needs measurement. Track unresolved workarounds, missing fields, ignored signals, and overdue investigations because resistance to change can stall integration even when the technical workflow works.
Use a phased first-quarter plan:
- Initial phase: Audit data flows, select high-risk characteristics, validate measurement systems, and define the pilot response plan.
- Build phase: Collect the baseline, set process limits, standardize methods, and connect results to the authoritative data record.
- Review phase: Evaluate signals, adoption, corrective-action closure, and business KPIs before expanding to another line or site.
Build QC into the process, connect it to trusted data, and keep the people who run the process engaged.
Polymerize helps materials R&D teams centralize experiments, formulations, and test results across spreadsheets, ELNs, and other silos, creating a structured foundation for traceable QC and AI-guided decisions. Visit Polymerize to see how the platform supports a move from disconnected records and reactive inspection toward governed, explainable quality improvement.