


The usual advice for calculating input and output is to add up what went into a batch, measure what came out, and divide. That arithmetic is necessary, but it won't explain why the same recipe produces different materials. In lab R&D, a defensible calculation connects formulation, process history, and provenance to a result you can reproduce, not just a property number you can plot.
Table of Contents
- What Counts as an Experimental Input and Output
- Formulas for Mass Balance Yield and Formulation Percent
- Solution Dilutions and Unit Conversions
- How to Calculate a 100 Gram Formulation Batch
- How to Report an Output You Can Reuse
- Tips When the Same Recipe Changes at Scale
- Choose the Next Experiment from the Ledger
What Counts as an Experimental Input and Output
Consider a hypothetical 100 g elastomer batch that measures 48 MPa tensile strength against a 50 MPa target. At pilot scale, the same nominal recipe performs worse. Before changing the formulation, the team needs to establish whether it repeated the experiment.
The recipe alone can't answer that question. Experimental input includes weighed ingredient masses, mixing order, temperature, rotational speed or shear conditions, residence time, and cure history. It also includes operator interventions, instrument settings, raw-material lot identifiers, and file metadata such as calibration records and collection time.
This distinction is easier to see when the lab and pilot records sit side by side.
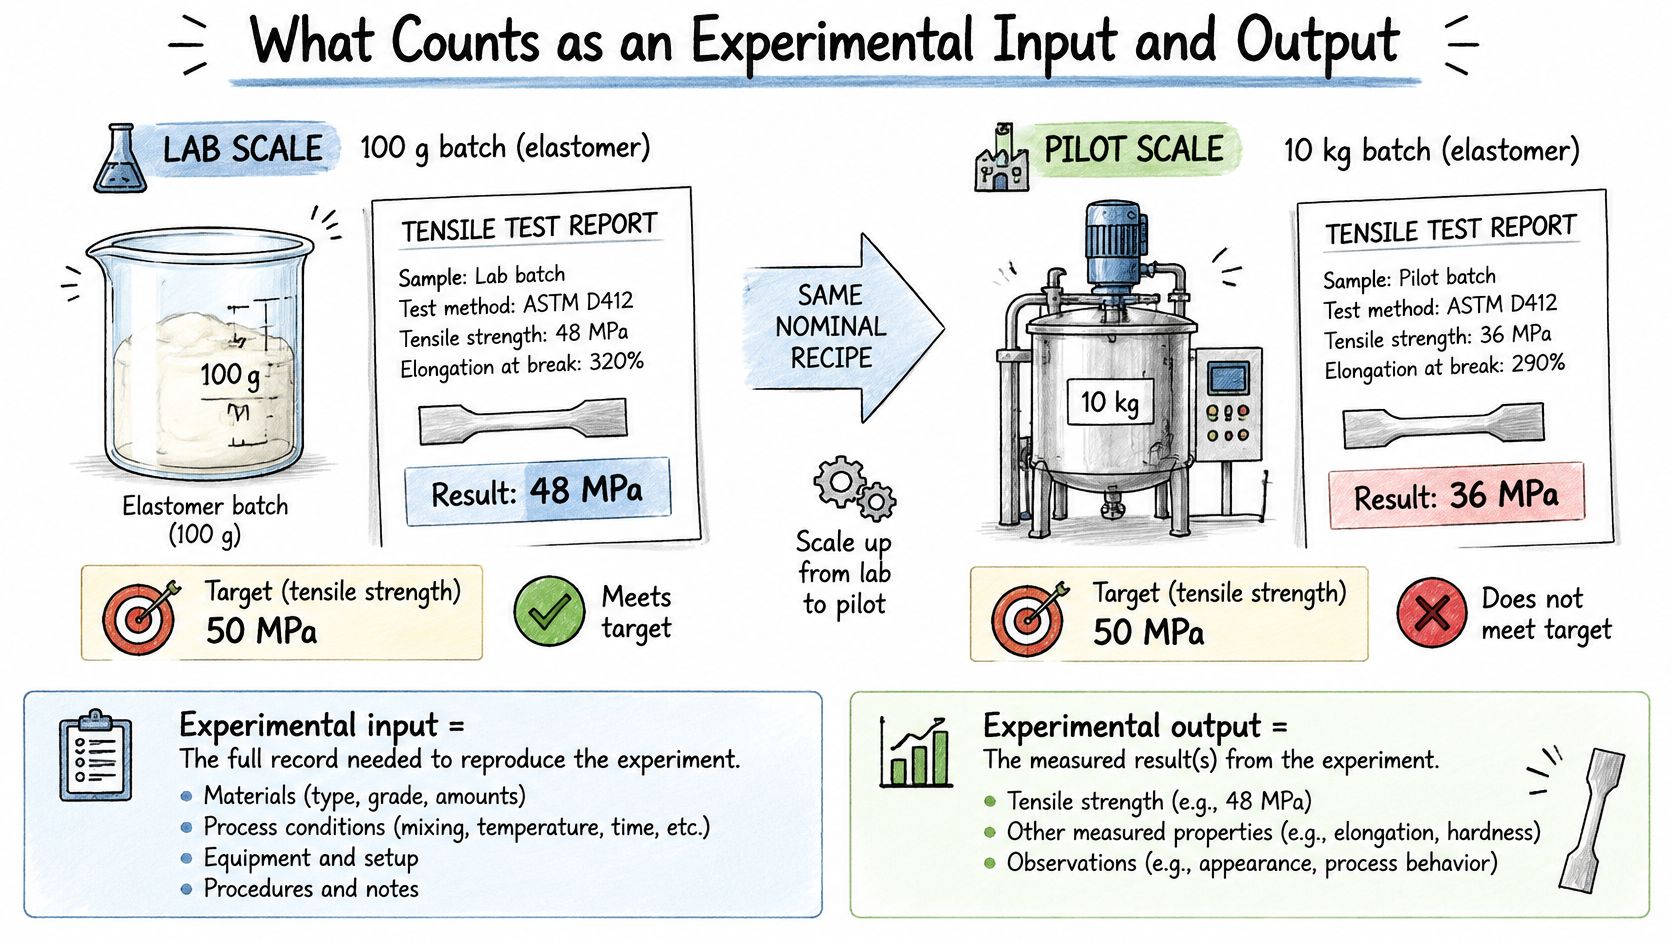
Experimental output includes recovered mass, yield under a stated definition, specification status, and uncertainty. A recipe-only spreadsheet omits how the material was made; a single predicted property omits how much trust to place in the result.
Use a one-row experiment ledger with separate fields for measured values and assumptions. A balance reading belongs under measured inputs. Supplier assay, estimated moisture, and an unverified transfer-loss explanation belong under assumptions.
Practical rule: Check whether the material accounting makes sense before interpreting the property.
For this hypothetical workflow, the team might adopt 98% to 102% mass closure as an investigation screen, not a universal acceptance standard. Actual limits should reflect the chemistry, collection method, and weighing uncertainty.
If you're establishing a workflow, Documind's guide to choosing methods for your first study offers useful context for planning what to measure. The formula table below supplies the arithmetic for the batch ledger.
Formulas for Mass Balance Yield and Formulation Percent
Lab formulas for input and output
All numerical examples in this table are hypothetical teaching calculations, not production benchmarks.
| Calculation | Formula | What it tells you |
|---|---|---|
| Mass balance closure | (Mass out / mass in) × 100 | Example: 98.4 g / 100 g × 100 = 98.4%. Investigate unaccounted material before interpreting properties. |
| Theoretical yield | (Actual product mass / theoretical product mass) × 100 | Example: 42 g / 50 g × 100 = 84%. Assess reaction or isolation efficiency against a justified theoretical mass. |
| Formulation weight percent | (Ingredient g / total batch g) × 100 | Example: 12 g / 100 g × 100 = 12 wt%. Confirm composition actually charged. |
| Mole or equivalent ratio | Moles A / moles B, or equivalents A / equivalents B | Use moles for molecular ratios and reactive equivalents for functional-group stoichiometry. |
| Process input | Mass/time, temperature, rotational speed, or defined shear measurement | Example settings: 2.5 kg/h, 180°C, 400 rpm. Record conditions needed to interpret performance. |
| Specific consumption | Input mass / acceptable output mass | Report kg input/kg good output. Compare material use on an acceptable-product basis. |
| Property versus target | (Measured property / target property) × 100 | Example: 48 MPa / 50 MPa × 100 = 96%. Quantify the relationship to a target, not automatic compliance. |
| Experiment hit rate | (Runs meeting every required specification / runs attempted) × 100 | Example: 7 / 20 × 100 = 35%. Assess how often the workflow produces an acceptable result. |
Start with material accounting
Mass closure asks where the charged material went. Count recovered product, collected condensate, retained samples, and measured residues within a clearly defined boundary. If only the product is weighed, call the calculation product recovery rather than implying that every output stream has been accounted for.
In the table's example, the missing material warrants checking transfer vessels, volatile collection, and balance entries. Under the illustrative screening rule, a gap beyond about two percentage points triggers investigation. That rule doesn't establish that the batch is chemically correct when it passes.
Theoretical yield answers a different question: how much intended product was obtained compared with what stoichiometry predicts? Its denominator must come from a reaction calculation with a defined limiting reagent and expected products. Don't substitute total charged mass merely because it's available.
Weight percent describes the charge. Include every ingredient in the denominator, including solvent when reporting an as-charged formulation. If you also calculate dry-solids composition, label it separately so colleagues don't compare incompatible percentages.
Match the calculation to the decision
A mole ratio counts molecules; an equivalent ratio counts reactive capacity. For polyurethane work, calculating an NCO index requires reactive-group information, not dividing isocyanate grams by polyol grams alone. Record the assay or equivalent-weight basis used.
Process settings belong beside composition, but they aren't interchangeable quantities. Rotational speed isn't a universal measure of shear, and a controller setpoint isn't necessarily the material's measured temperature. Preserve both when available, along with equipment geometry and sensor location.
Specific consumption uses acceptable output as its denominator. Counting rejected material as good output makes a process look more efficient than it is.
Likewise, property attainment and experiment hit rate support different decisions. A measured-to-target ratio is useful for a minimum-strength requirement, but not for every specification: lower values may be preferable for viscosity, and some properties must stay inside a window.
A percentage is only meaningful when the numerator, denominator, and acceptance rule are named.
Compute closure and weight percent first. Then calculate yield, property attainment, and hit rate using definitions that another scientist can apply without guessing.
Solution Dilutions and Unit Conversions
Solution preparation supplies input values for the same ledger. For a dilution that conserves solute, use C₁ × V₁ = C₂ × V₂, with concentration and volume expressed on compatible bases.
In a hypothetical preparation, diluting 10 mL of 2.0 M stock to 0.5 M gives:
V₂ = (2.0 × 10) / 0.5 = 40 mL final volume.
Bring the solution to that final volume with solvent. The nominal solvent addition is 30 mL, but don't assume volumes are perfectly additive when accurate preparation requires a volumetric endpoint.
Keep measured mass separate from calculated amount
- Record the target. Enter stock concentration, target concentration, and final volume with units.
- Solve for the required stock volume or solute mass. The Herbilabs Labware reconstitution tool can provide a calculation cross-check, but the ledger should retain the inputs and concentration basis.
- Convert after weighing. For example, 25.0 g ÷ 100 g/mol = 0.25 mol.
- Keep assay corrections visible. Assuming 98% assay, the effective ingredient mass is 25.0 × 0.98 = 24.5 g, not a replacement for the recorded balance reading.
A hypothetical solution containing 5.0 g brought to 100 mL final volume is 5.0% w/v. That isn't the same as weight percent. Check mg versus g versus kg, and mL versus L, before transferring calculated values into the formulation record.
How to Calculate a 100 Gram Formulation Batch
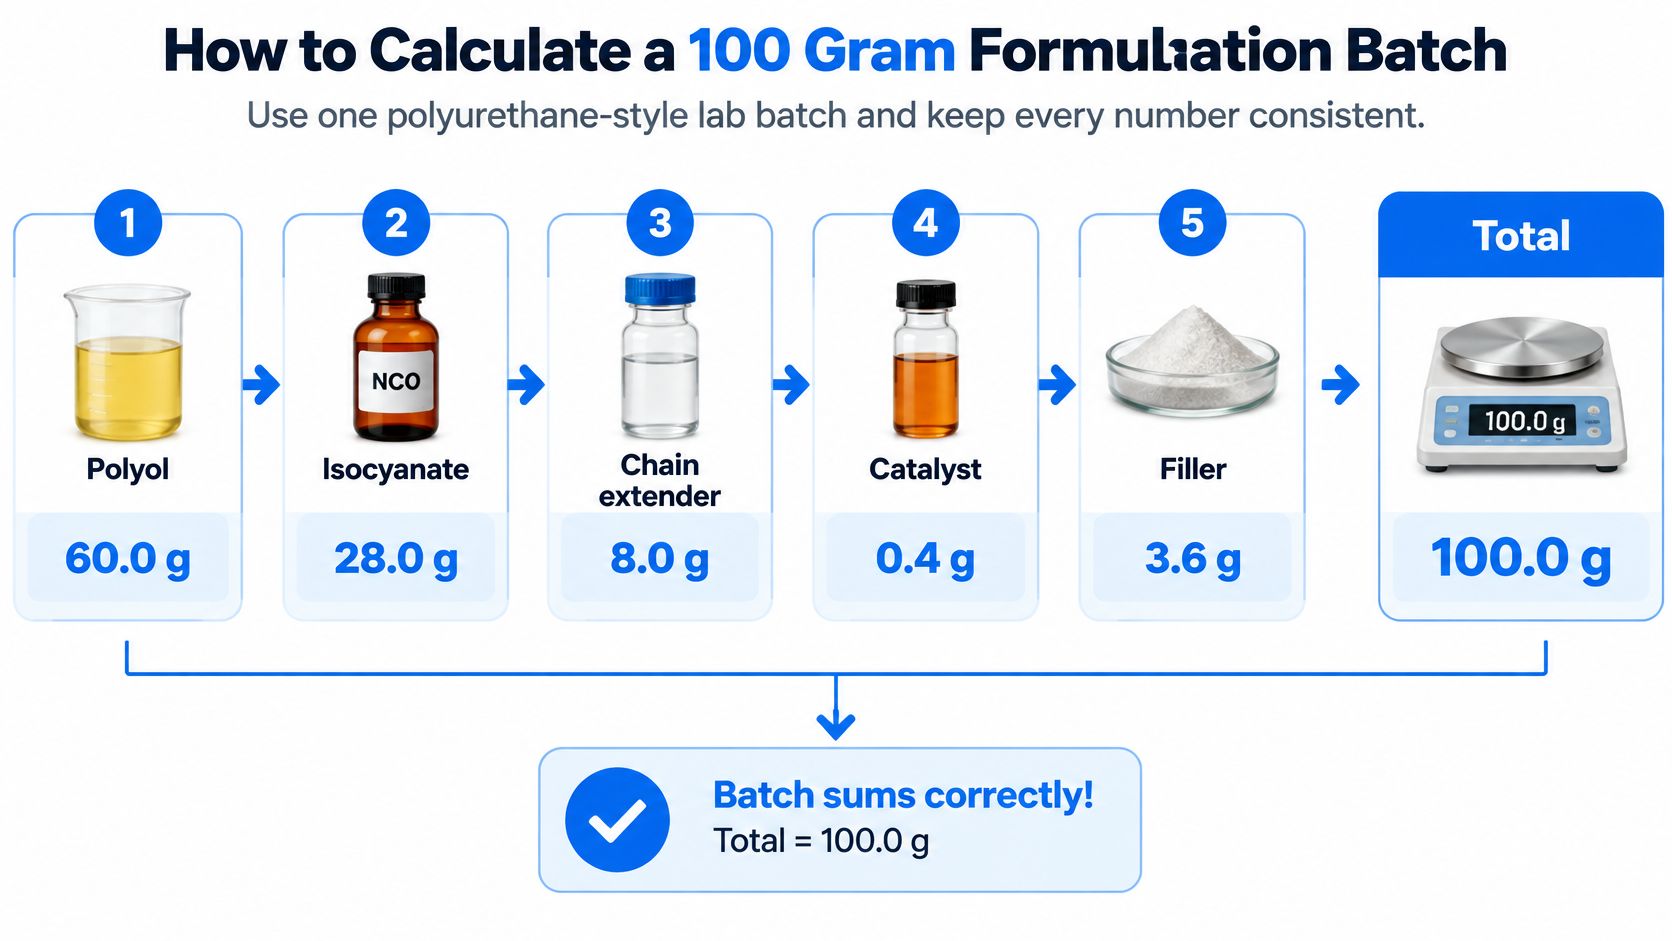
Use the following hypothetical polyurethane-style batch to practice the accounting. It's an arithmetic example, not a validated synthesis procedure or a recommendation to combine particular commercial chemicals.
The charge diagram shows the ingredient contributions before processing.
Establish the actual charge
- Confirm the balance and tare each addition. Verify balance status, identify the receiving vessel, and record actual additions rather than copying nominal targets. For this example, assume the measured additions equal the values below.
100 g polyurethane batch charge
| Ingredient | Charged (g) | Weight percent |
|---|---|---|
| Polyol | 60.0 | 60.0% |
| Isocyanate | 28.0 | 28.0% |
| Chain extender | 8.0 | 8.0% |
| Catalyst | 0.4 | 0.4% |
| Filler | 3.6 | 3.6% |
| Total charged | 100.0 | 100.0% |
Sum the charge and calculate composition. The additions total 100.0 g, so each ingredient's gram value is numerically equal to its weight percentage. That shortcut works here because of the batch total, not because grams and percentages are interchangeable.
Attach process conditions to the same experiment. For this scenario, record 2 minutes at 400 rpm, followed by 2 hours at 80°C. Also record the actual mixing order, mixer identification, temperature trace, and when timing began. A nominal cure duration means little if colleagues start the clock at different events.
Account for the recovered material
After curing, suppose the team recovers 98.2 g solid and collects 1.2 g moisture or volatile material. Closure is (98.2 + 1.2) / 100.0 × 100 = 99.4%, leaving 0.6 g unaccounted. Record transfer loss as a suspected explanation unless residue measurements establish it; don't turn an assumption into a measured output.
Declare the yield basis. If an independent stoichiometric calculation predicts 97.0 g solid, then 98.2 / 97.0 × 100 ≈ 101.2%. Apparent over-recovery calls for checking retained moisture, solvent, contamination, and the theoretical calculation. It doesn't demonstrate exceptional reaction efficiency.
Without a justified theoretical product mass, report 98.2 / 100.0 × 100 = 98.2% isolated mass recovery on charged mass. If your lab calls that isolated yield, include the definition in the field name. It isn't interchangeable with reaction yield.
The embedded video is an optional companion to the worked calculation.
Calculate property attainment. Suppose tensile strength measures 48 MPa against a minimum requirement of 50 MPa. Attainment is 96%, and the measured value misses that requirement.
Assign the run's status and retain the evidence. Check every required gate, including any processing or business constraints. Keep the raw tensile curve, specimen preparation details, test method, instrument identity, and deviations attached to the experiment. Other gates remain pending until tested; missing results aren't passes.
The compact row below can be pasted into a spreadsheet and expanded with linked charge, process, and characterization records. Use an actual attached file reference rather than inventing a filename.
| Run | Charge | Process | Solid | Collected volatiles | Closure | Unaccounted | Recovery basis | Tensile / target | Status | Raw curve |
|---|---|---|---|---|---|---|---|---|---|---|
| Example batch | 100.0 g; ingredient detail above | 400 rpm, 2 min; 80°C, 2 h; order recorded separately | 98.2 g | 1.2 g | 99.4% | 0.6 g; suspected transfer loss | 98.2% of charged mass | 48 / 50 MPa; 96% | Tensile off-spec; other gates pending | Attach instrument file reference |
How to Report an Output You Can Reuse
Suppose a separate hypothetical repeat set produces 46, 48, and 53 MPa. The mean is 49 MPa, and the maximum-minus-minimum range is 7 MPa. A minimum requirement of 50 MPa hasn't been cleanly demonstrated just because the average looks close.
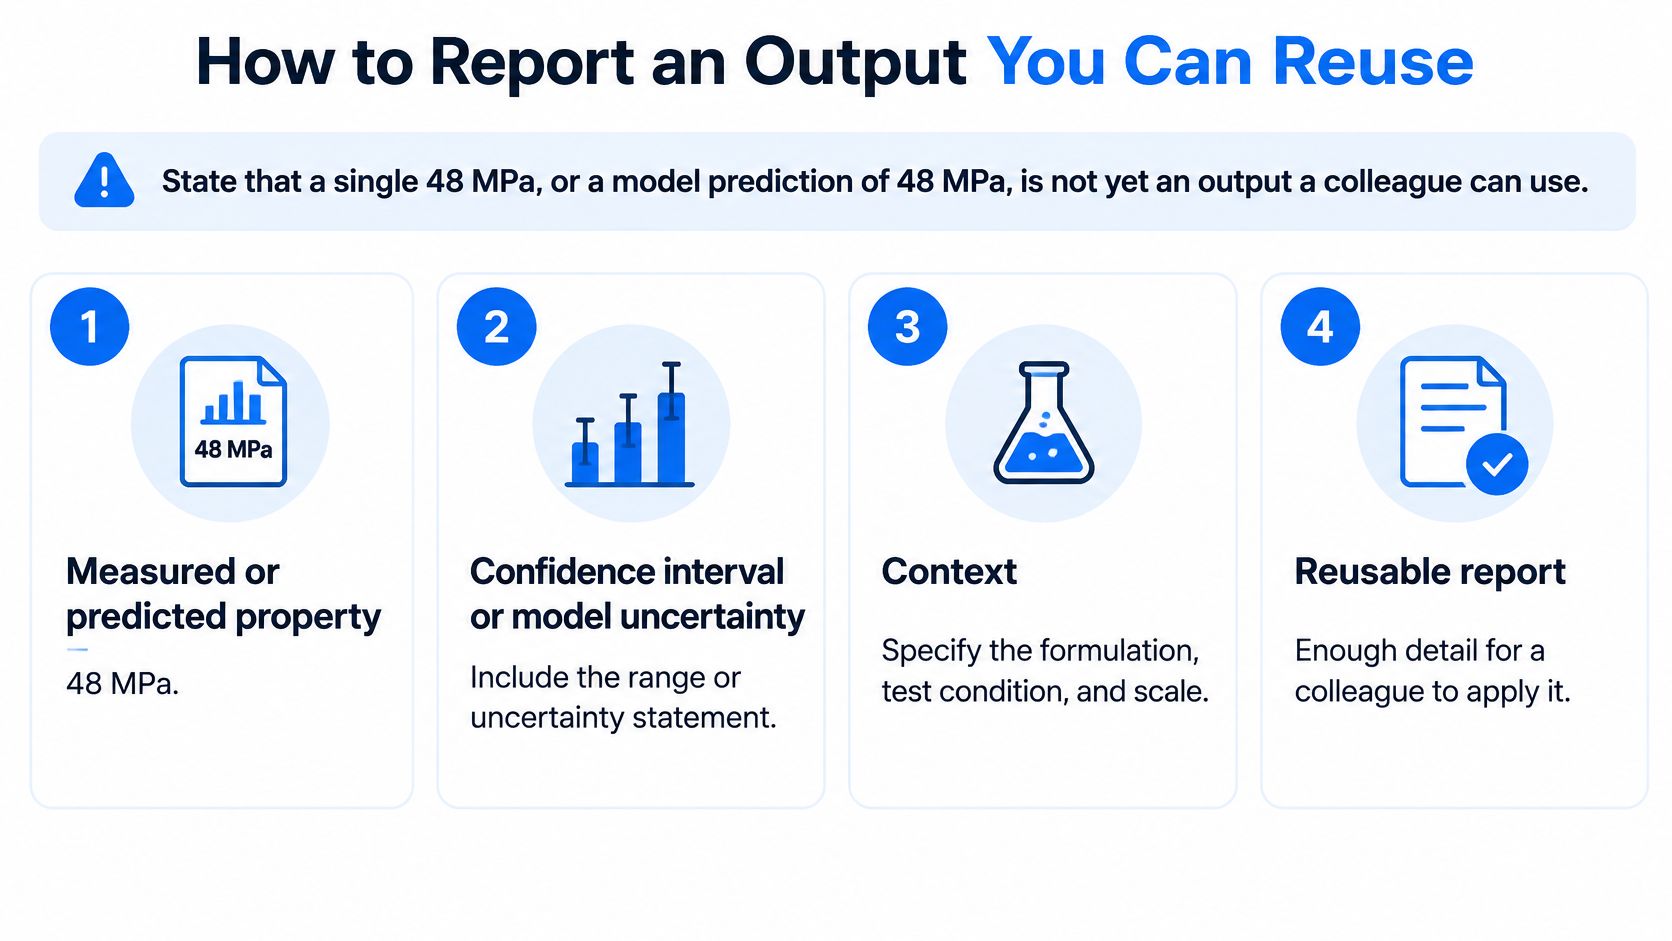
Neither that average nor a model prediction is a complete output. A colleague needs to know what was measured, how variable it was, and where the result can reasonably be applied.
Use a report package rather than an isolated property cell.
Separate observations from confidence
The 2025 materials-AI review in Wiley describes sparse, heterogeneous materials datasets, emphasizes experimental verification of predictions, and highlights the loss of useful negative data through publication bias toward successful outcomes. These limitations matter directly when a team decides whether a calculated output is ready for reuse.
Build the report around these fields:
- Property and origin. Label measured results, model predictions, and derived calculations separately. Include test conditions and specimen preparation.
- Uncertainty. Report the repeat count, spread, and uncertainty method. Distinguish independent batches from specimens cut from the same batch.
- Applicability domain. State whether the formulation, material families, process conditions, and scale resemble the records used to build the model.
- Historical error. Show observed-versus-predicted errors for comparable held-out experiments, not only agreement with training data.
- Next action. Identify the experiment that would resolve the most consequential uncertainty.
A repeat range isn't a confidence interval. If a justified calculation produced an illustrative interval of 47 to 51 MPa at 95% confidence, report its confidence level, method, and what it describes. Don't assign that interval to the repeat set above without calculating it, and don't confuse confidence in a mean with the prediction interval for a future batch.
Keep failures and metadata attached
Include failed and off-spec experiments in the attempted-run denominator under a documented counting policy. Record why each failed: a processing interruption, an invalid test, and a genuine property miss are different outcomes. Preserve them without treating all of them as equally valid property labels.
Technical success also isn't business acceptance. A material can pass tensile testing while failing cost, restricted-substance requirements, pot life, shelf life, or manufacturability. Report those gates separately rather than hiding them inside a general success label.
Release gate: If essential metadata or the applicability assessment is missing, label the output provisional rather than feeding it to an optimizer as ground truth.
Retain raw-file metadata, calibration information, detector configuration where relevant, and collection time. Document reprocessing settings so a colleague can distinguish a new analysis from a new experiment.
Finally, state whether repeats were prepared and tested on the same day or across different batches and days. Same-day repeatability alone doesn't establish the variability a team will encounter during routine production.
Tips When the Same Recipe Changes at Scale
When weight percentages match but performance doesn't, compare process histories before changing composition. MIT's account of its AI-guided materials experimentation workflow describes early reproducibility problems caused by subtle precursor-mixing and processing differences.
Compare what the material experienced
- Log numeric process inputs. Record mixing sequence, measured peak temperature, residence-time distribution where available, cure history, and logged motor energy normalized by processed mass.
- Separate measurements from assumptions. Put a Karl Fischer moisture result in a different field from assumed supplier moisture.
- Calculate site differences. Compare temperature profiles, energy input, addition timing, and equipment geometry rather than relying on matching recipe names.
In a hypothetical comparison, a lab mixer operated at 400 rpm for 2 minutes and a pilot extruder with a 90-second residence time represent different process inputs. Their operating numbers aren't direct equivalents, and matching rotational speed wouldn't establish matching shear.
Don't add model complexity to compensate for a missing temperature trace. Capture the trace.
Treat differing variables as candidate causal inputs, not proven causes. A variable becomes more credible as a causal lever when the team changes it deliberately while controlling plausible alternatives; a correlation between site and tensile strength doesn't establish the mechanism.
During scale-up, recalculate consumption using acceptable output. Include pilot scrap and documented material losses so an attractive laboratory recovery figure doesn't conceal poor manufacturing performance.
Choose the Next Experiment from the Ledger
Use explicit decision branches when you calculate input and output. For the hypothetical batch, the decision depends on whether material accounting is credible and whether the property miss exceeds established repeatability.
- Accounting is unresolved. If closure falls outside the workflow's illustrative screening band, investigate collection, transfer, and weighing before modifying the formulation. Repeat the run when the missing material prevents a trustworthy interpretation.
- Accounting is acceptable, but the target is indistinguishable within established variability. Freeze the input set as a baseline. Resolve repeatability or vary a single candidate causal input in a controlled comparison.
- Accounting is acceptable and the miss is confirmed. Change the best-supported composition or process lever, and retain the failed run.
The worked batch closes at 99.4%, but its 48 MPa result misses the 50 MPa requirement. If independent repeatability evidence confirms that miss, the third branch applies: test cure temperature as a candidate lever while holding other recorded inputs fixed. Without that evidence, repeat the baseline rather than calling a single result a confirmed mean.
Do not optimize a property until both the input ledger and the output package are filled.
Fill one real batch using these formulas today, then mark the single input or uncertainty your next experiment will address. Keep formulation, process, and results in one connected record, even if your starting tool is a spreadsheet.
Polymerize helps teams connect fragmented formulation, process, and test records, while Polymerize Connect surfaces hidden correlations between ingredients and performance metrics. Visit Polymerize to explore how a connected experimental record can support property prediction and better-informed choices about the next experiment.
Put your R&D data to work
See how materials teams use Polymerize to plan fewer experiments and reach target properties faster.