



Workers using explainable AI reached 96.3% balanced accuracy, compared with 88.6% for black-box AI, and defect detection rose to 93.0% in the same study (Nature study on human-AI collaboration and explainability). That result changes the usual conversation. Explainability isn't just a governance checkbox. It can change how well people work with models.
For materials R&D leaders, that matters because most AI failures don't start with bad math. They start when a scientist sees a prediction, can't trace the reasoning, and decides not to trust it. A model says a formulation will fail. Another says a defect pattern is acceptable. If nobody can tell whether the model is picking up chemistry, process physics, or noise, the team slows down.
That's where explainable AI methods become useful. They help scientists ask better questions. Which variables pushed the prediction? Was the effect global across the dataset or local to one sample? Is the explanation pointing to a real mechanism, or only to a statistical association?
This gets even harder in materials data. Formulations are high-dimensional. Interactions are non-linear. Historical experiments are fragmented across spreadsheets, ELNs, PDFs, and team memory. A simple feature-importance chart often looks neat while hiding the underlying issue.
The practical challenge isn't only generating explanations. It's validating causal fidelity and linking explanations to prior experimental precedent so teams can decide what to test next with confidence.
Table of Contents
- Introduction to Explainable AI Methods
- Interpretability and explainability are not the same
- Global and local views answer different questions
- Correlation is not causal fidelity
Introduction to Explainable AI Methods
A materials team trains a model to predict tensile strength for a new polymer blend. Validation looks good, so the team uses it to rank candidate formulations. Then a chemist asks a simple question: which variables drove the top recommendation, and do those drivers match what the lab already knows from prior experiments?
That question often decides whether the model enters the workflow or stays in a slide deck.
Materials R&D groups do not treat predictions as final answers. They treat them as hypotheses. A useful AI system therefore has to do more than rank options or flag defects. It has to show reasoning in a form scientists can inspect, debate, and test against process knowledge, formulation history, and follow-up experiments.
In enterprise materials work, an explanation is valuable only if it can survive contact with the lab.
That standard is higher than basic model transparency. In high-dimensional materials data, hundreds or thousands of descriptors can move together. A model may assign importance to a variable that travels with the underlying cause rather than causing the outcome itself. For an R&D leader, this is the difference between a clue and a costly detour.
Historical lab practice offers a useful comparison. Experimental scientists have long used controls, ablation studies, and factor screening to separate signal from coincidence. Explainable AI methods serve a similar role for machine learning systems. They help teams ask, "What influenced this prediction?" Then they support the harder question, "Would that explanation still hold up if we changed the experiment, the batch, or the measurement context?"
That second question matters in enterprise settings. A feature importance chart may look persuasive, yet still fail under scale-up, supplier changes, or instrument drift. For materials programs, explainability has to connect to causal fidelity validation, not just readable visuals.
Three common moments make this clear:
- Formulation screening: Scientists need to know whether the model is responding to chemically meaningful inputs or to proxy variables tied to a narrow historical dataset.
- Process troubleshooting: Engineers need explanations that distinguish true process drivers from logging errors, sensor noise, or batch-specific quirks.
- Transfer to pilot and production: Teams need to test whether the factors highlighted by the model remain stable outside the lab.
Good explainable AI methods turn model output into something closer to experimental reasoning. They do not produce perfect truth. They give teams an inspectable starting point, one that can be checked against known mechanisms and challenged with the same discipline used in the lab.
Understanding the Key Concepts
Before choosing a method, it helps to build a small vocabulary. Most confusion in explainable AI comes from people using the same words to mean different things.

Interpretability and explainability are not the same
Interpretability asks whether a person can understand how a model works by looking at the model itself. A small decision tree is interpretable. A linear model with a manageable number of variables often is too.
Explainability is broader. It includes tools that help people understand a complex model after the model has already been trained. That's where many explainable AI methods live.
A simple analogy helps:
- A transparent model is like a glass beaker. You can look through it and see what's happening.
- A post-hoc explanation is like taking a sample from an opaque reactor and analyzing it after the process runs.
Both can be useful. They answer different questions.
Global and local views answer different questions
Scientists also get tripped up by the difference between global and local explanations.
A global explanation describes how the model behaves overall. It's comparable to a cookbook. You learn which ingredients usually matter across many dishes.
A local explanation describes one prediction. That's like tasting a single finished dish and asking why it turned out salty, brittle, opaque, or unstable.
Here's the quick distinction:
| Question | Explanation type |
|---|---|
| Which variables matter most across the whole model? | Global |
| Why did this one sample fail the prediction threshold? | Local |
| How does changing one feature affect predictions on average? | Global |
| What pushed this single image or formulation toward a defect label? | Local |
Practical rule: If you're deciding what experiment to run next, you usually need both views. The global view shows recurring drivers. The local view shows why this specific sample behaved the way it did.
Correlation is not causal fidelity
This is the part many teams skip.
An explanation can be easy to read and still be misleading. If a method highlights a variable because it's correlated with the outcome, that doesn't mean the variable is a true causal driver. In materials systems, correlated variables are everywhere. Temperature may move with viscosity. Viscosity may move with mixing speed. Mixing speed may track operator choice or equipment line.
Causal fidelity asks a stricter question: does the explanation reflect the underlying mechanism behind the model's prediction in a way that aligns with physical reality?
That standard matters more in materials R&D than in many business workflows because scientists don't just want predictions. They want reasons they can test in the lab.
A useful mental map is this:
- Transparency means the model's structure is understandable.
- Post-hoc explanation means you add an explanation after training.
- Global explanation means overall behavior.
- Local explanation means one decision.
- Causal fidelity means the explanation tracks something real, not just something correlated.
Once that map is clear, the methods themselves become much easier to compare.
Taxonomy of Explainable AI Methods
The field of explainable AI feels messy until you sort methods by two questions. Does the method work across many model types, or only specific architectures? And does it explain the model broadly, or a single prediction?
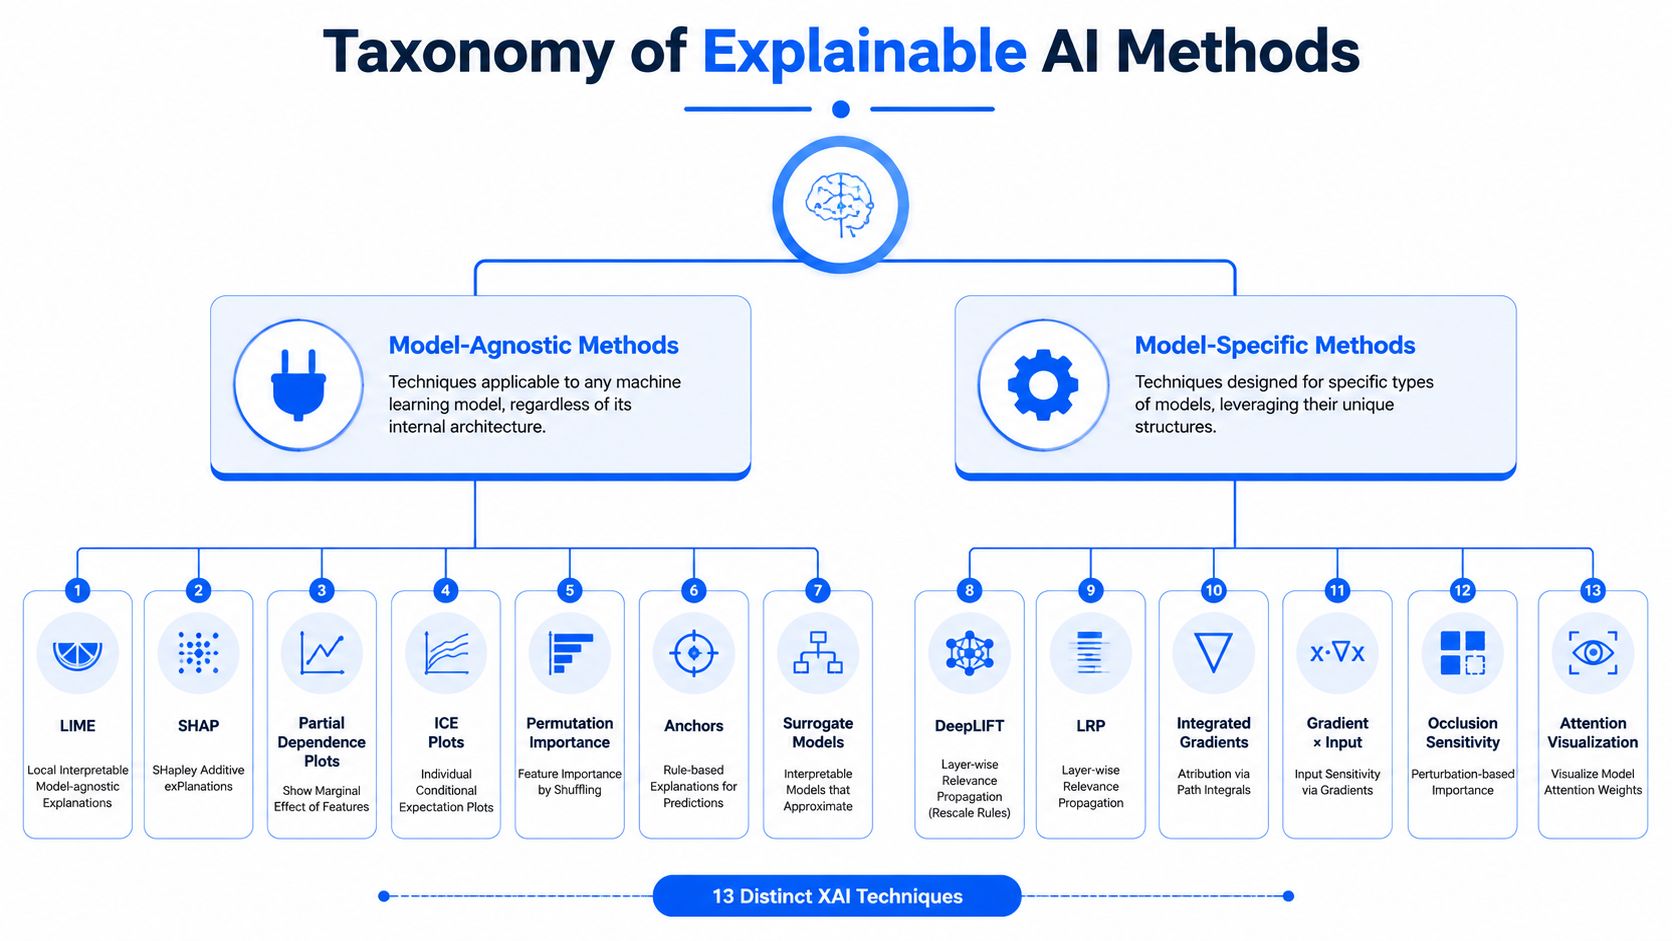
Two main branches
The first branch is model-agnostic methods. These work with many model types because they don't rely on internal architecture details. Common examples include SHAP, LIME, Partial Dependence Plots, and Permutation Feature Importance.
The second branch is model-specific methods. These rely on how a particular class of model is built. In deep learning, examples include LRP, DeepLIFT, Grad-CAM, and related saliency approaches.
A systematic review identified 13 distinct XAI techniques for prediction tasks, and SHAP appeared in 35 out of 44 reviewed articles, about 79.5%, ahead of LIME, Partial Dependence Plots, and Permutation Feature Importance (systematic review of XAI methods in prediction tasks). That doesn't mean SHAP is always the best choice. It does mean it has become the default reference point in much of the literature.
A practical taxonomy looks like this:
Model-agnostic and global
- Partial Dependence Plots
- Permutation Feature Importance
- Global SHAP summaries
Model-agnostic and local
- LIME
- Local SHAP values
- Counterfactual explanations
Model-specific and local
- LRP
- DeepLIFT
- Grad-CAM
- Saliency maps
Model-specific and broader concept analysis
- Methods that trace internal activations or concepts in specialized architectures
A short explainer video can help if your team is new to the categories:
Why materials data complicates the taxonomy
The taxonomy is neat. Materials data is not.
A tabular model for formulation screening may use hundreds of descriptors, process conditions, and historical measurements. An imaging model may analyze microstructure, defects, or phase morphology. A graph model may represent molecules or polymer fragments. Each data type changes what “good explanation” means.
For tabular data, feature attribution often makes sense because scientists can inspect variables directly. For images, heatmaps or relevance propagation are usually more intuitive. For molecular graphs, teams often want explanations that point to substructures, bonds, or motifs.
A method can fit the model and still fail the workflow. The right method has to match the scientist's decision, not just the algorithm.
Counterfactual explanations and structural causal approaches are also gaining attention because they answer more action-oriented questions. Instead of “what mattered,” they ask “what would need to change” or “what mechanism could plausibly cause the shift.” In enterprise settings, those questions are often more useful than a ranked feature list.
So the taxonomy isn't only academic classification. It's a decision aid. It helps you choose whether you need a map of the whole model, a microscope on one prediction, or a way to connect both to scientific reasoning.
Comparing Explainable AI Methods in Practice
Once teams understand the categories, the harder question appears. Which method should you use in a live materials workflow?
There isn't one answer because each method trades off fidelity, speed, ease of interpretation, and fit with data type. Some are good for quick debugging. Some are better for audit trails. Some are strong in imaging but less useful for tabular formulations.
A practical comparison table
| Method | Use Case | Pros | Cons |
|---|---|---|---|
| SHAP | Tabular models, formulation prediction, property models | Works across many model types. Supports local and global explanations. Often intuitive for feature attribution. | Can be computationally heavy. Feature importance can still be mistaken for causation. |
| LIME | Quick local explanation for one prediction | Model-agnostic. Useful when teams want a simple local approximation. | Can be unstable because it depends on perturbations and a surrogate approximation. |
| LRP | Deep neural networks, imaging, molecular graphs | Preserves the original model structure. Useful for tracing relevance back through layers. | Mostly limited to compatible deep models and requires more specialized implementation. |
| PDP | Understanding average feature effects across a model | Good for a broad behavioral view. Easy to discuss with mixed technical audiences. | Average trends can hide interactions and local exceptions. |
| Counterfactual explanations | Action-oriented decisions and what-if analysis | Easy for nontechnical users to understand. Useful for next-step reasoning. | May suggest changes that are unrealistic, incomplete, or disconnected from historical precedent. |
SHAP is often the first method teams try for tabular materials datasets because it produces a ranked view of feature contributions and works across many model classes. If you have a model predicting tensile strength, cure behavior, permeability, or yield, SHAP can help identify which input features pushed a single prediction upward or downward.
LIME is also model-agnostic, but it works differently. It perturbs the input around one example and fits a simple surrogate model nearby. That makes it useful for local inspection, especially when a team wants a fast explanation for one odd result. The trade-off is that the explanation is an approximation of local behavior, not a direct trace of the original model.
How to choose under real lab constraints
LRP belongs to a different family. It's particularly useful when the model is a deep neural network and the input has spatial or structural meaning. In imaging-heavy workflows, that matters a lot. According to the referenced overview, Layer-Wise Relevance Propagation achieves over 90% localization accuracy on salient regions compared to gradient-based methods, which is why teams use it to trace atomic-level or defect-level drivers in imaging contexts (overview of popular XAI methods including LRP).
That makes LRP a strong fit for tasks like:
- Microstructure image review: Which region of the image drove the defect or phase classification?
- Surface inspection: Did the model attend to the actual flaw or to background texture?
- Molecular representation models: Which part of a graph or encoded structure influenced the output?
PDP sits at the opposite end of the experience. It gives a broad, averaged view of how one feature affects predictions. This is helpful when a team wants to ask, “As additive concentration rises, how does the predicted property usually move?” But averaged curves can flatten out interactions that matter in real formulations.
Counterfactual explanations are often the easiest for decision-makers to understand. They answer a practical question: what change might flip the model output? In enterprise R&D, that's useful when scientists want next-step guidance rather than diagnosis alone. But counterfactuals can be too detached from reality if they ignore processing limits, chemical feasibility, or prior experiments.
A few selection rules help:
- Use SHAP when the data is mostly tabular and the team needs both model-wide and single-sample explanations.
- Use LIME for quick local debugging when exact fidelity matters less than speed and intuition.
- Use LRP for neural networks in imaging or structured deep models where spatial attribution matters.
- Use PDP when leadership or cross-functional teams need an overall behavioral summary.
- Use counterfactuals when the next experiment or adjustment is the central question.
The best workflow rarely stops at one method. Teams often pair a global method to understand the model and a local method to decide whether one prediction is trustworthy.
For materials R&D, that pairing becomes even more important because methods that look convincing in isolation can fail once the team asks, “Would we run an experiment based on this explanation?”
Evaluation Metrics for Explainability and Validation
Generating an explanation is easy compared with proving it deserves trust.
That's where many explainable AI projects break down. Teams produce feature rankings, heatmaps, or counterfactuals, then treat those outputs as if they were validated scientific evidence. In materials work, that's risky because high-dimensional systems can produce explanations that look plausible while tracking noise or proxy variables.
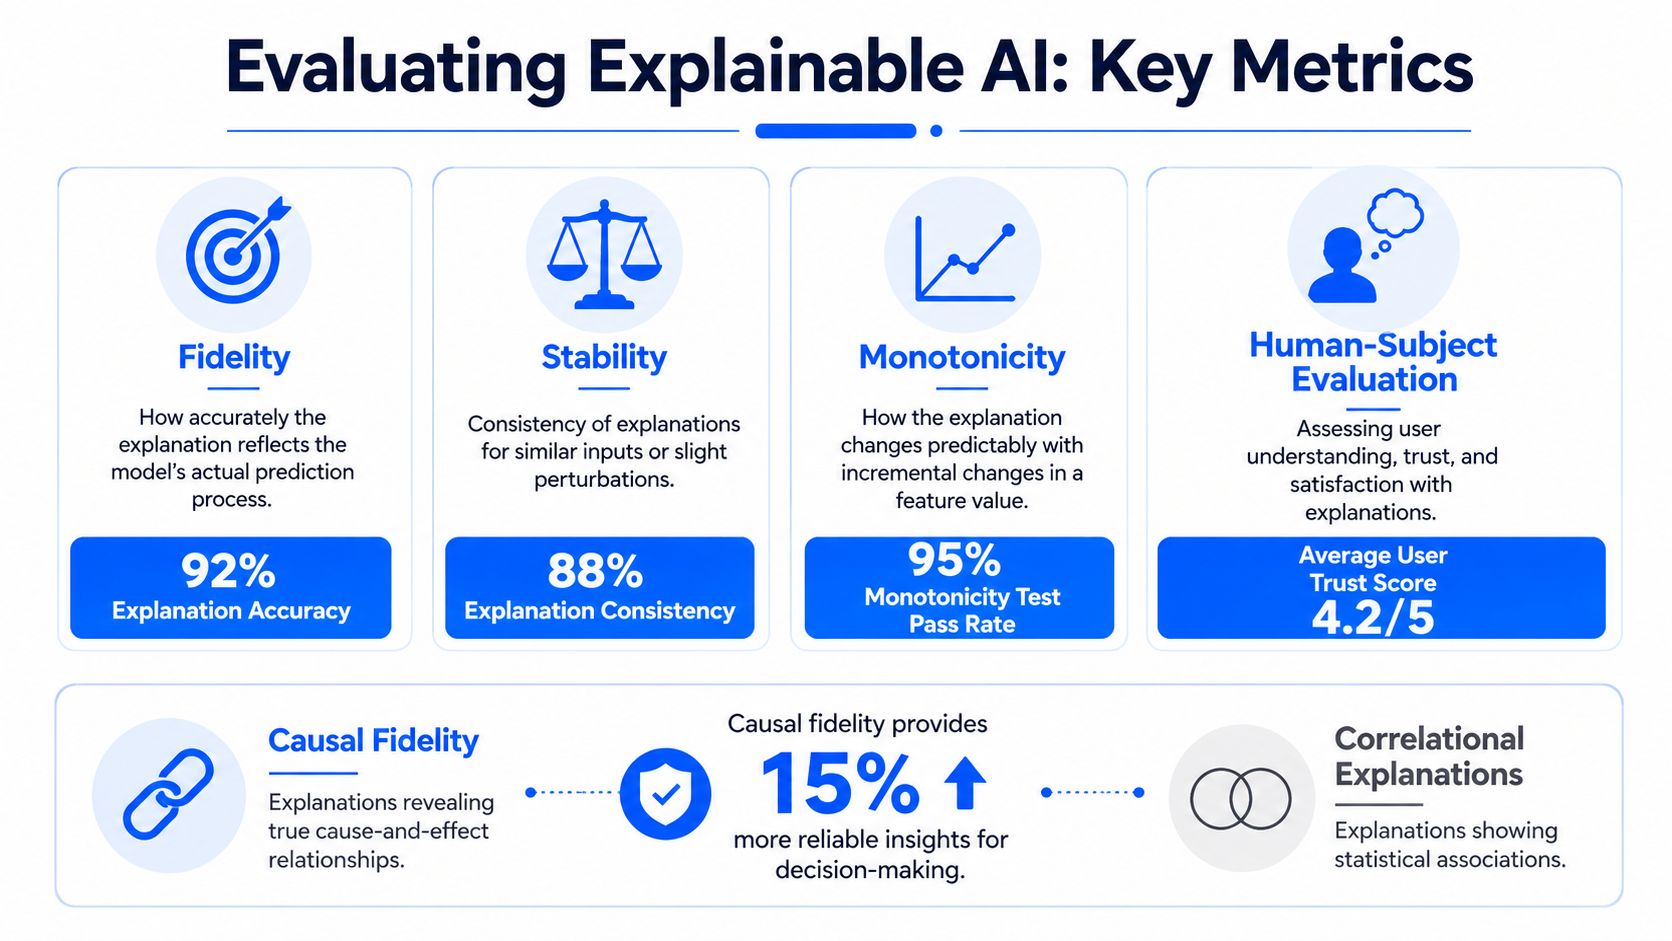
What good evaluation looks like
Several evaluation ideas matter in practice.
Fidelity asks whether the explanation reflects the model's true behavior. If an explanation says variable A drove the prediction, fidelity asks whether the model's internal behavior supports that claim.
Stability asks whether similar inputs get similar explanations. If tiny input changes produce wildly different explanations, scientists should be cautious.
Monotonicity looks at whether explanation behavior changes predictably when a feature changes in a controlled way. If increasing a formulation component steadily raises the predicted response, the explanation should shift in a way that matches that pattern.
Human-subject evaluation matters too. An explanation isn't useful if the scientist reading it can't interpret it correctly or act on it sensibly.
A compact way to think about evaluation is:
- Model faithfulness: Does the explanation match the model?
- Scientific plausibility: Does it align with domain understanding?
- Operational consistency: Does it remain stable enough for workflow use?
- Decision utility: Can a scientist use it to choose the next experiment?
How to test causal fidelity in materials work
The hardest metric is causal fidelity.
A 2025 review notes that much existing XAI work doesn't adequately validate causal correctness in high-dimensional physical systems, and specifically points out that methods like LIME and SHAP lack rigorous benchmarks for causal correctness in complex settings (review discussing causal fidelity gaps in XAI.pdf)). That gap is exactly why materials teams shouldn't stop at attractive attribution plots.
A strong validation routine usually includes several layers.
First, test explanations against known synthetic cases. If you generate data where the true drivers are known, the method should identify those drivers rather than distractors.
Second, test against historical lab precedents. If prior experiments repeatedly showed that a certain processing condition changed morphology only under specific composition ranges, the explanation should be consistent with that pattern.
Third, use expert challenge sessions. Put the explanation in front of formulation chemists, process engineers, or imaging specialists and ask them where it seems physically credible and where it doesn't.
An explanation becomes more trustworthy when it survives disagreement from domain experts, not when it avoids scrutiny.
Fourth, compare methods. If SHAP, LRP, and a counterfactual story all point in related directions, confidence tends to rise. If they conflict sharply, that's a signal to investigate before acting.
A practical validation checklist for materials teams looks like this:
- Start with a benchmark case: Choose a property or defect domain where scientists already understand likely drivers.
- Run multiple explanation methods: Don't rely on one view when the system is highly non-linear.
- Cross-check against physical knowledge: Ask whether the explanation matches known mechanisms or process constraints.
- Review against prior experiments: See whether the explanation aligns with what earlier successes and failures suggest.
- Document limits: Record where the explanation is informative and where it remains uncertain.
This is the enterprise-ready shift. Don't ask only whether the explanation is readable. Ask whether it can survive validation against chemistry, process knowledge, and experimental history.
Best Practices for Materials R&D Workflows
Most explainable AI failures in materials programs are workflow failures, not algorithm failures. The method may be fine. The data is fragmented, variable definitions are ambiguous, and explanation outputs never connect back to how scientists decide what to test.

Build the data foundation first
Start with experimental data hygiene. Explanations built on inconsistent naming, missing metadata, or mixed units won't become reliable just because the XAI method is advanced.
A practical sequence works better:
- Clean the records: Standardize units, normalize naming conventions, and map aliases for the same ingredient, process step, or instrument output.
- Tag context: Record batch conditions, instrument settings, operator notes, and formulation lineage where possible.
- Separate controllable from observational variables: Scientists need to know which inputs they can change in the next experiment.
- Flag likely causal candidates: Mark variables that domain experts believe could plausibly drive the outcome, even if the model later revises that view.
Governance belongs here too. If your team handles sensitive IP or regulated data, explanation workflows should sit inside the same controls that govern the rest of the R&D stack, including ISO 27001, SOC 2, and GDPR/CCPA-aligned practices where applicable.
For teams building or running explanation-heavy workflows at scale, infrastructure matters because some methods can be compute-intensive. If you're evaluating environments for training and post-hoc analysis jobs, this guide to AvenaCloud on JVPS GPU servers is a practical reference point for understanding GPU server options in a hosted setup.
Connect explanations to enterprise workflows
A bigger blind spot is historical context. A 2026 perspective highlights that XAI literature rarely addresses how to integrate explanations with structured historical case banks and experimental precedents in enterprise settings (perspective on XAI and historical experimental precedents). That gap matters because scientists rarely ask only, “What feature mattered?” They ask, “Have we seen this failure mode before?”
That changes how teams should implement explainable AI methods.
Instead of showing only feature importance, the workflow should also link the prediction to comparable prior experiments, failed formulations, process excursions, and known scale-up issues. That lets scientists inspect not just the model rationale but the organizational memory around similar cases.
One workable operating pattern is:
- Centralize historical experiments from ELNs, spreadsheets, LIMS exports, and reports.
- Attach explanations to prediction records so every recommendation carries its rationale.
- Retrieve similar precedents when the model produces a prediction or counterfactual.
- Collect scientist feedback on whether the explanation was useful, misleading, or incomplete.
- Retrain and refine using that feedback as part of model governance.
This is also the right place to mention tooling choices. Platforms such as Polymerize are built around a centralized data backbone and domain-specific explainable models so teams can connect model outputs with confidence-scored drivers and historical precedents in a materials context.
The best practice isn't “add SHAP to the dashboard.” It's “make explanations part of how scientists review evidence, compare with past work, and decide the next experiment.”
Applied Examples for Enterprise Workflows
Abstract method comparisons help, but teams usually understand explainable AI methods when they see them inside a real workflow.
Polymer blend optimization
A formulation team is trying to improve a polymer blend for a target property window. Data from prior runs is ingested through a central connection layer that pulls spreadsheets, ELN records, and assay results into one structured dataset. A predictive model scores candidate blends, and SHAP is used to explain why one candidate is likely to outperform another.
The scientist doesn't just see that a blend scores well. They see which formulation ratios and process variables pushed the prediction up or down. Then they compare that explanation with similar historical runs that failed for compatibility or processing reasons. The explanation becomes a screening tool, not a final verdict.
That workflow resembles how other industries use AI to move from raw prediction to operational action. A useful parallel appears in Transforming smart buildings with AI, where the value comes from connecting model outputs to real operational decisions rather than treating AI as a detached analytics layer.
Imaging and defect interpretation
In an imaging workflow, the sequence is different. Microscopy or inspection images are passed into a deep model, and LRP highlights the regions that most strongly influenced the model's judgment. Instead of accepting a defect flag blindly, the scientist checks whether the model focused on a meaningful region such as a defect boundary, phase feature, or structural anomaly.
That matters because imaging models can latch onto artifacts. A visual relevance map gives the team a way to challenge the model before they commit to a costly follow-up experiment.
In enterprise settings, the strongest workflows combine those explanation outputs with confidence information and prior comparable images. Scientists can then ask three grounded questions at once. What did the model predict? Why did it predict that? Have we seen something like this before?
That combination is what makes explainable AI methods operationally useful in R&D rather than merely interesting in a demo.
Conclusion and Next Steps
Explainable AI earns its place in materials R&D when scientists can test an explanation the same way they test a hypothesis. A prediction may point to a promising formulation or flag an image as defective. The explanation has to survive a harder question. Does it align with known mechanisms, and does it hold up when compared with prior experimental results?
That standard matters even more in high-dimensional materials data, where many variables move together and a plausible story can still be wrong. In practice, causal fidelity validation works like a control experiment for the model's reasoning. If an explanation highlights the same factors that repeatedly mattered in historical lab work, confidence rises. If it conflicts with well-established experimental precedent, the team has a clear signal to investigate before acting.
Different methods answer different questions. SHAP can clarify which inputs shaped a tabular prediction. LRP can show which image regions drove a classification. PDPs can reveal broad response patterns. Counterfactuals can suggest what to change next. The key decision is not which method wins in the abstract. It is which method matches the decision point, the data type, and the validation standard your team can defend.
A practical starting point is small and disciplined.
Choose one model that already affects a real R&D decision. Add one explanation method. Compare its outputs with expert review and archived experiments. Then formalize the workflow so explanations are stored, checked against precedent, and reviewed with confidence scores before they influence expensive lab work.
Putting these principles into practice requires infrastructure built for the specific demands of materials science.
If you want to operationalize explainable AI in materials development, Polymerize is one place to explore how centralized experimental data, domain-specific models, confidence-scored explanations, and historical precedent can fit into a single R&D workflow.
Put your R&D data to work
See how materials teams use Polymerize to plan fewer experiments and reach target properties faster.