


The most popular advice about the chemical properties of advanced materials is also some of the least useful: find the value in the datasheet, compare it with the target, and select the material that appears to perform best. That approach works only when the test method, specimen history, surface condition, process route, and scale are already aligned. In real R&D, they rarely are.
A material that looks identical by nominal composition can behave differently after purification, drying, mixing, thermal conditioning, coating, or dispersion. The practical question isn't, “What are this material's chemical properties?” It's, “Which properties did we measure, under what conditions, and will the same structure exist in production?” That shift matters for polymers, composites, coatings, catalysts, battery materials, graphene, and every formulation where interfaces and processing history affect performance.
Table of Contents
Redefining Chemical Properties for Modern R&D
A material's chemical properties aren't always fixed constants. Elemental composition, bonding, and crystal structure may be intrinsic, but many properties used to make engineering decisions depend on how a process creates and preserves a distribution of structures. Particle size, morphology, defect density, moisture content, agglomeration, and dispersion state can all vary between batches without changing the material name on the purchase order.
This is why a formulation that performs in a small laboratory vessel can fail after scale-up. Mixing, heat transfer, addition order, residence time, purification, and drying can alter the structures that control the measured result. The material isn't merely a molecule or nominal recipe. At production scale, it is the output of a process.
Practical rule: Treat every reported property as a value attached to a specimen, method, and process history, not as a universal identity card.
Intrinsic properties and process-dependent properties
A useful first separation is between intrinsic descriptors and process-dependent outcomes.
Intrinsic descriptors include elemental composition, molecular architecture, bonding, crystallinity, and surface chemistry. They help explain what the material can do. Process-dependent properties include particle-size distribution, defect density, morphology, moisture level, and dispersion quality. They explain what a particular batch is likely to do in a particular application.
That distinction changes how teams should build specifications. Instead of storing “conductivity” or “Tg” as isolated values, a well-built record connects the result to sample preparation, instrument, protocol, operator, conditioning, and batch identity. Without that context, a database can make incomparable experiments look like training data.
A 2025 autonomous synthesis study demonstrated automated preparation and in-line characterization across reaction volumes from below 10 mL to several hundred milliliters, while noting that nanomaterial scale-up is often difficult and that mixing batches may be useful when direct scale-up fails (the autonomous synthesis study). The operational lesson is important. Reproducibility at one scale doesn't prove transferability to another.
What R&D leaders should change
A production-ready property definition should answer four questions:
- What structure was measured? Record composition, morphology, crystallinity, defects, surface treatment, and dispersion state where relevant.
- How was the specimen prepared? Include drying, milling, mixing, curing, annealing, conditioning, and storage history.
- Which method produced the value? Record instrument, calibration, protocol, detection limits, and analysis convention.
- What uncertainty follows the value? Store replicate variation, batch variation, and known scale-transfer limitations.
This isn't bureaucratic overhead. It prevents teams from optimizing a number that disappears when the process changes. AI models are only as reliable as the distinctions represented in their data. If a model sees laboratory measurements without scale, thermal history, or surface condition, it can produce precise-looking predictions with weak practical meaning.
Thermal and Rheological Transitions in Polymers
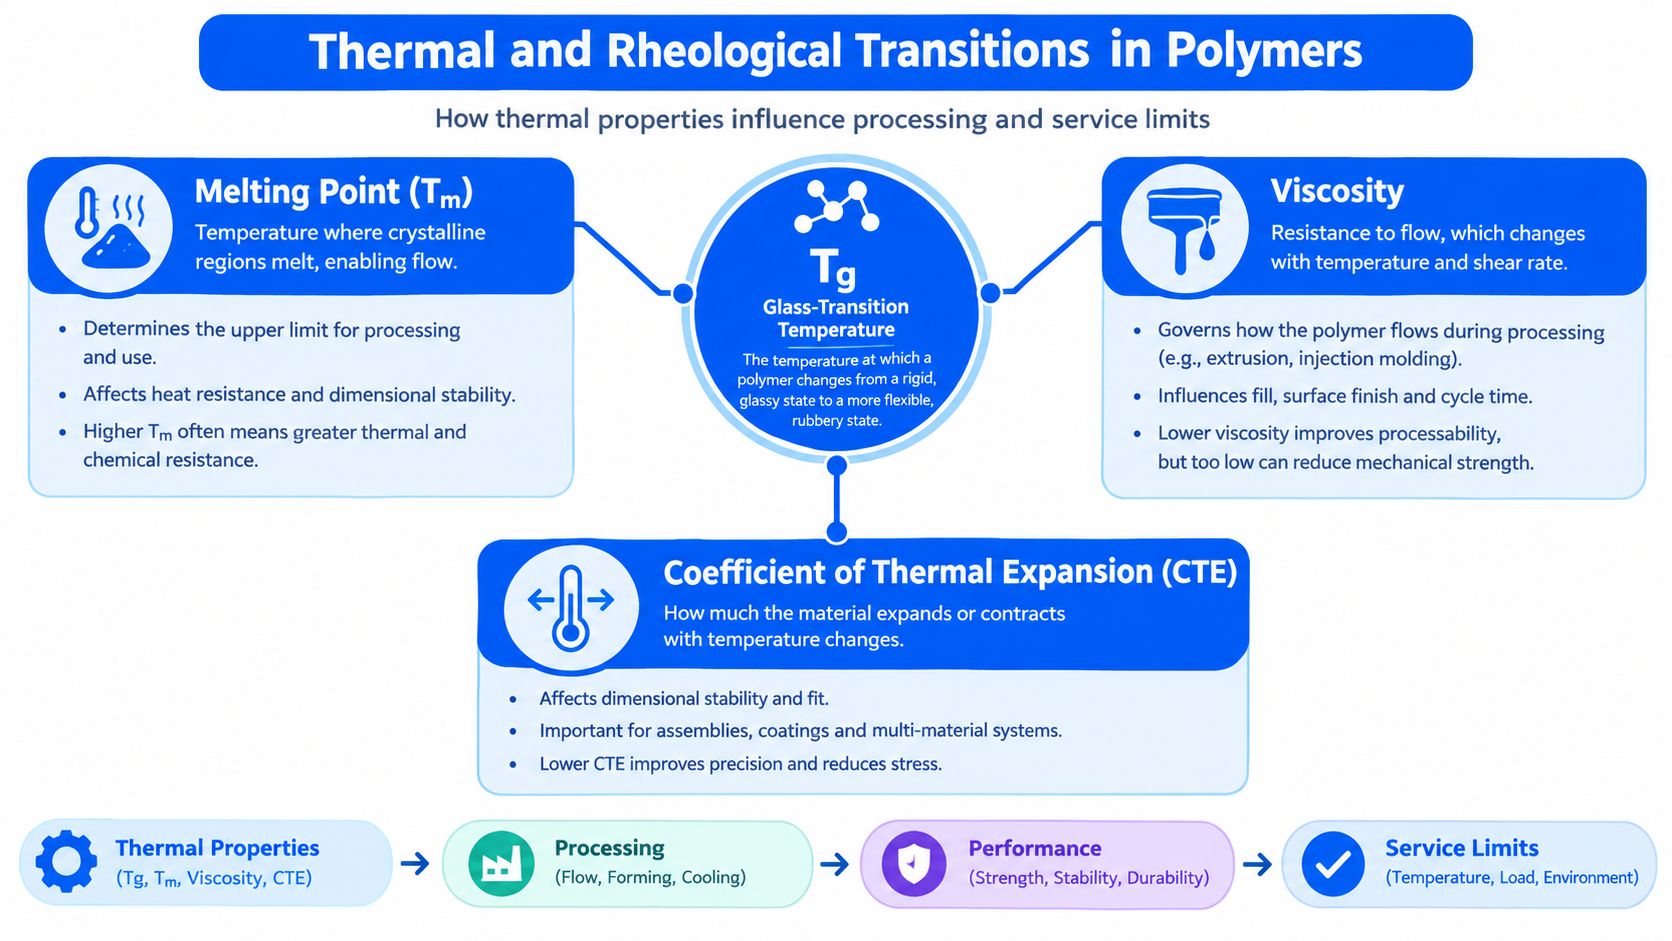
Thermal behavior determines whether an advanced polymer can be mixed, extruded, molded, cured, stored, and used without losing dimensional or mechanical performance. Yet teams often treat glass-transition temperature, or Tg, as though it were a permanent molecular constant. It isn't. Tg describes a temperature range in which molecular mobility changes sharply as a material moves from a rigid glassy state toward a softer rubbery state.
That transition affects modulus, viscosity, dimensional stability, processing windows, and service limits. The measured value depends on polymer architecture, crosslink density, molecular weight, moisture uptake, aging, thermal history, test frequency, heating or cooling rate, and analytical method. A value copied from a supplier datasheet can therefore be unsuitable for direct comparison with an internally measured result.
Why the protocol belongs beside Tg
DSC, DMA, rheometry, and TMA don't interrogate exactly the same manifestation of a polymer transition. They can produce materially different values because each technique applies a different stimulus and observes a different response. DSC follows heat flow, DMA follows mechanical response, rheometry follows flow behavior, and TMA follows dimensional change.
Cooling rate is particularly important. NIST reports that Tg may increase by approximately 3–5 °C for each tenfold increase in cooling rate (NIST guidance on glass-transition measurement). A formulation database that stores “Tg = value” without the cooling or heating protocol is not preserving a complete property record.
At minimum, record:
- Transition convention: State whether the value is an onset, midpoint, or another defined point.
- Thermal protocol: Capture heating or cooling rate, atmosphere, and thermal history.
- Specimen condition: Note moisture exposure, conditioning, aging time, and sample geometry.
- Method context: Store instrument type, frequency where applicable, and analysis settings.
Rheology connects chemistry to equipment
Rheology translates molecular and morphological changes into process behavior. Viscosity controls filling, pumping, coating, extrusion, and mold filling. Shear-thinning behavior may help a formulation flow through equipment while recovering enough structure after deposition. A material that looks acceptable under one shear condition can behave poorly when the shear history changes.
The right comparison isn't “Which formulation has the lowest viscosity?” It is “Which formulation has a viscosity profile compatible with the actual process?” Measure across the relevant temperature and shear conditions, then connect the result to solids loading, molecular weight distribution, particle interactions, curing state, and residence time.
A practical development record should link rheological curves to processing events. If a lab sample was mixed gently but production applies intense shear, the resulting dispersion and viscosity may not match. If the material absorbs moisture between preparation and testing, the apparent transition and flow response may shift again.
A single thermal value can support a decision only when the measurement conditions support the comparison.
Surface Chemistry Versus Bulk Composition
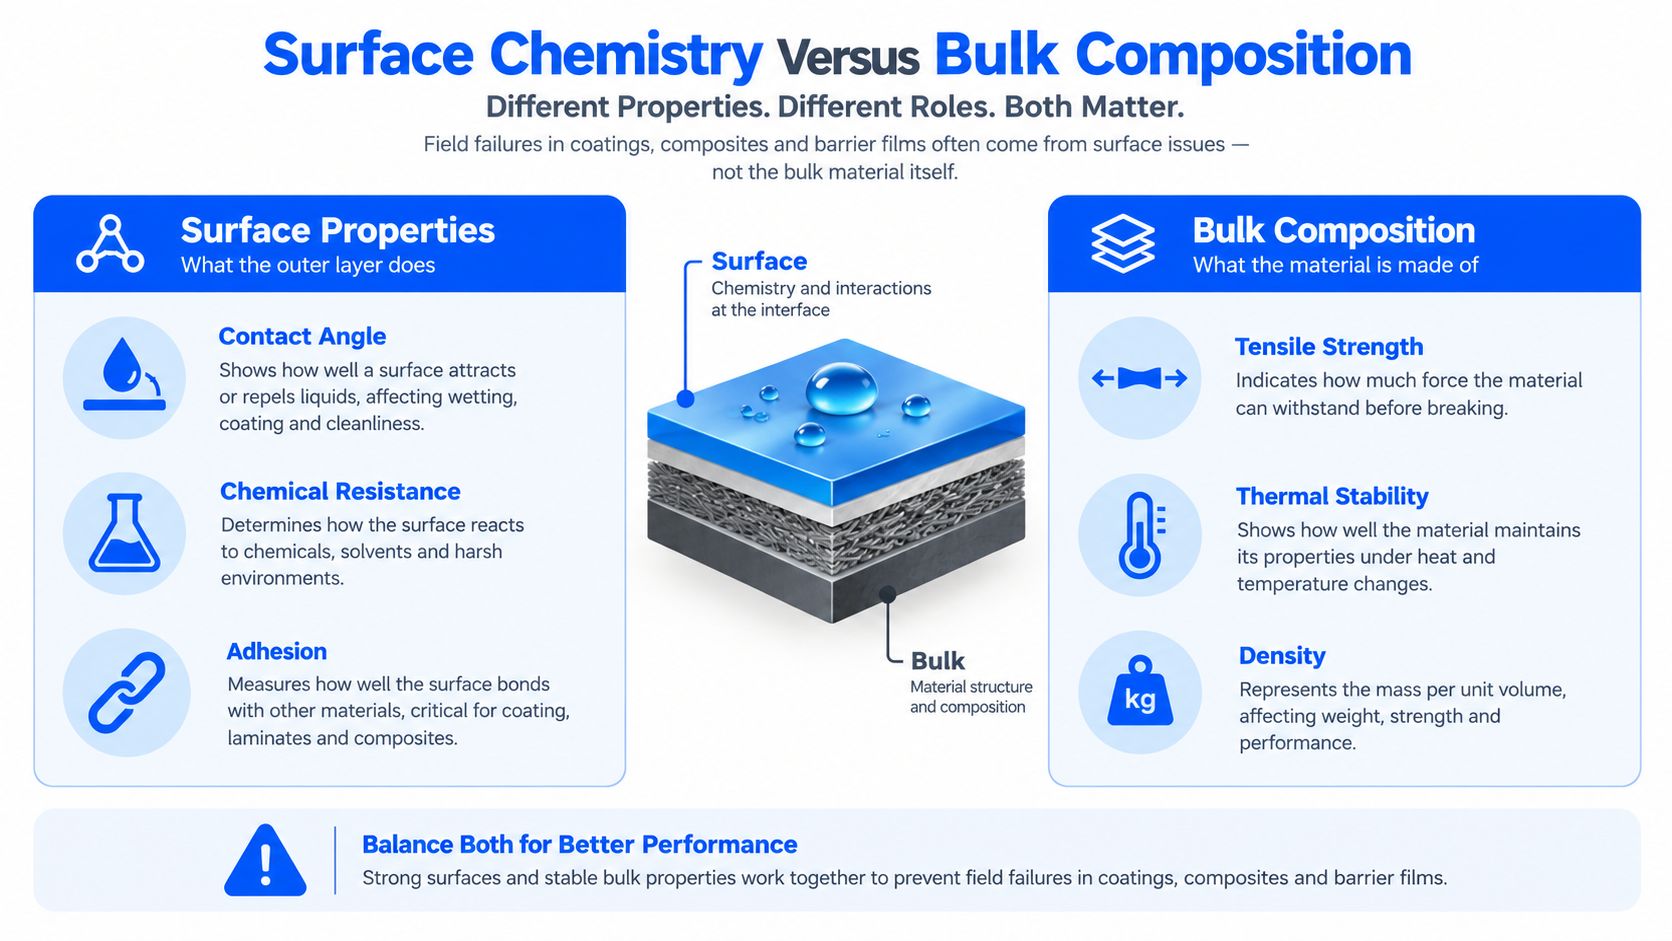
Bulk composition often receives more attention because it is easier to sample and describe. But adhesion, wetting, corrosion, catalysis, barrier behavior, and many degradation reactions occur at or near the interface. A coating can have the expected bulk formulation and still fail because the surface contains contamination, an altered functional group population, residual processing aid, or an uneven treatment layer.
Bulk thermal and mechanical methods remain essential. DSC, thermogravimetry, spectroscopy, chromatography, tensile testing, and density measurements describe the material's interior or overall response. They won't necessarily reveal the chemistry that controls whether a coating bonds to a substrate or whether a treated polymer surface resists water.
Choose the method for the failure mechanism
Standardization literature identifies Auger electron spectroscopy, X-ray photoelectron spectroscopy, and secondary-ion mass spectrometry as widely used techniques for surface chemical analysis of advanced materials (surface chemical analysis methods).
Their roles differ:
- XPS provides near-surface elemental composition and chemical-state information. It suits questions about oxidation state, functional groups, surface treatment, and contamination.
- AES offers high spatial-resolution surface analysis. It helps investigate localized defects, particles, inclusions, and patterned interfaces.
- SIMS detects molecular or elemental fragments with very high sensitivity and supports depth profiling. It is useful when trace species, additives, fragments, or layered chemistry matter.
The method should follow the suspected mechanism. If delamination appears only in one region of a coated part, spatial resolution may matter more than a broad average. If a barrier failure involves a thin treatment layer, depth information becomes central. If trace contamination is suspected, sensitivity may determine the choice.
Build a defensible sampling plan
Surface analysis can create misleading answers if sample preparation changes the surface. Cleaning may remove the species responsible for the failure. Sputtering may alter chemical states or mix layers. Poorly documented storage can allow oxidation or moisture uptake before analysis.
Define the following before testing:
- Sampling location: Compare good and failed regions, production center and edge, exposed and protected surfaces.
- Cleaning protocol: State whether the surface is analyzed as received, rinsed, solvent-cleaned, or otherwise treated.
- Analysis depth: Separate native surface chemistry from deeper layers and bulk composition.
- Calibration and controls: Use calibration standards, reference materials, and appropriate charge compensation.
- Replicates and reporting limits: Distinguish a local anomaly from a batch-wide condition.
The most useful result correlates surface chemistry with bulk performance. A changed XPS spectrum matters because it explains adhesion loss, wetting change, catalytic activity, or degradation, not because the spectrum is interesting on its own.
Atomic Bonding and Macroscopic Performance
A material's headline property is often a consequence of atomic arrangement, but scale-up determines whether that property survives processing. Graphene shows both sides of this relationship. It consists of a single carbon-atom layer in a hexagonal lattice, with a carbon-carbon bond distance of approximately 0.142 nanometers (Nobel Prize technical material on graphene). Its regular sp²-bonded network supports delocalized electrons, helping explain its electrical conductivity and zero-band-gap semiconductor behavior.
The same lattice links bonding to mechanical, thermal, optical, and barrier performance. Strong covalent bonds support mechanical strength, while the flexible two-dimensional structure allows stretching of up to approximately 20% of its original size, according to Nobel Prize educational material (Nobel Prize explanation of graphene). Nobel-related summaries describe graphene as more than 100 times stronger than steel, while also noting its near transparency and ability to conduct heat more effectively than copper.
One lattice, several outcomes
Reported graphene bulk electrical conductivity is approximately 0.96 × 10^6 Ω⁻¹ cm⁻¹, compared with about 0.60 × 10^6 Ω⁻¹ cm⁻¹ for copper. Its measured thermal conductivity is approximately 5,000 W m⁻¹ K⁻¹, versus roughly 401 W m⁻¹ K⁻¹ for copper in the cited values. Graphene also absorbs only about 2.3% of visible light, allowing a single layer to transmit nearly 98% while remaining electrically conductive.
These properties share a structural origin: a continuous carbon lattice, electron delocalization, strong bonding, and extremely low thickness. The lattice is sufficiently dense that even helium atoms cannot readily pass through an intact sheet, despite graphene being only one atom thick.
For formulation work, the relationship is useful but conditional. Defects interrupt transport. Functional groups can improve compatibility while reducing conductivity. Dopants alter carrier concentration. A polymer matrix can improve handling while lowering effective network connectivity in a graphene composite. R&D teams should therefore specify the target structure, defect tolerance, interface condition, and processing history, rather than rely on a single property value measured on pristine material.
From material science to manufacturing intelligence
AI models for composites, coatings, and lightweight structures need descriptors for bonding, morphology, interfaces, and processing, not only nominal formulation percentages. Measurement metadata should record specimen preparation, dispersion state, thermal history, test direction, and environmental conditions. Without that context, a model may treat incompatible measurements as comparable and recommend a formulation that performs well in a controlled test but fails during production. Practical examples of automotive AI implementations also show why material decisions must connect with production and quality workflows.
Andre Geim and Konstantin Novoselov isolated graphene in 2004 and received the 2010 Nobel Prize in Physics. The durable lesson is broader than that milestone. Nanoscale order, defect density, surface chemistry, and processing history can jointly determine conductivity, transparency, strength, heat transport, and barrier performance at macroscopic scale.
Reference Catalog of Key Material Properties
A useful property catalog should help a chemist decide what to measure next, not just collect attractive values. Organize properties by the failure or design decision they support. Then attach each metric to a method, unit, specimen condition, and formulation lever.
| Property Category | Key Metrics | Standard Test Methods | Formulation Impact |
|---|---|---|---|
| Mechanical | Tensile strength, modulus, elongation, fracture behavior | Relevant ASTM or ISO tensile and mechanical protocols | Adjust polymer architecture, crosslinking, reinforcement, plasticization, and filler dispersion |
| Electrical | Conductivity, dielectric constant, dielectric loss, breakdown voltage | Electrical resistivity, impedance, dielectric, and breakdown protocols selected for the material form | Control conductive networks, insulation, filler loading, moisture sensitivity, and interface quality |
| Optical | Refractive index, haze, transmittance, reflectance, color | Spectrophotometry, haze, refractive-index, and optical transmission methods | Tune particle size, phase separation, crystallinity, pigment dispersion, and surface roughness |
| Chemical stability | Oxidation resistance, hydrolysis, solvent resistance, UV degradation | Accelerated aging, spectroscopy, chromatography, mass-change, and chemical exposure protocols | Select stabilizers, antioxidants, barrier additives, protective coatings, and more resistant backbones |
| Thermal | Tg, melting behavior, decomposition onset, thermal expansion | DSC, DMA, TGA, TMA, and thermal cycling methods | Set processing windows, curing schedules, service limits, and dimensional controls |
| Rheological | Viscosity curve, yield behavior, storage modulus, loss modulus | Rotational rheometry, oscillatory rheology, capillary rheometry | Match flow behavior to pumping, coating, extrusion, printing, and molding |
Read the table as a decision system
Mechanical properties tell you whether the formulation survives load, strain, impact, and repeated deformation. Tensile strength alone can hide brittleness. Modulus describes stiffness, while elongation helps reveal whether the material can accommodate movement without cracking. Reinforcement may raise stiffness but reduce ductility if the interface or dispersion is poor.
Electrical properties require attention to geometry and conditioning. Conductivity in a dry film may not predict behavior under humidity. Dielectric constant and dielectric loss matter for signal integrity and energy storage, while breakdown voltage depends on defects, thickness, voids, and local field concentration.
Optical measurements are often surface-sensitive in practice. Haze can increase through agglomeration, phase separation, roughness, or crystallization even when the chemical composition remains unchanged. A formulation team should connect optical failure to morphology before changing the chemistry blindly.
Chemical stability needs an exposure scenario. Oxidation, hydrolysis, solvent attack, and UV degradation don't occur identically across temperature, humidity, oxygen availability, radiation, and mechanical stress. An accelerated test is useful only when its failure mechanism resembles the service condition.
A property catalog becomes valuable when every metric points to an intervention. If a number can't guide composition, processing, characterization, or acceptance criteria, it may not belong in the core decision set.
The Scale-Up Reality of Chemical Properties
A milligram-scale result describes potential, not production performance. Scale-up can change morphology, defect populations, surface state, and dispersion even when the nominal formulation remains unchanged. The relevant question is therefore whether the process reproduces the chemical and physical state that the application requires.
Separate intrinsic traits from manufacturing distributions. Elemental composition and crystallinity may remain relatively stable, while particle-size distribution, defect density, moisture content, aggregation, and dispersion respond to mixing, heat transfer, feed timing, purification, drying, and storage. Production quality is a distribution problem, not a single-point comparison.
The autonomous synthesis work noted earlier illustrates the issue. Automated preparation across reaction volumes from below 10 mL to several hundred milliliters demonstrated the value of in-line characterization and reported that direct nanomaterial scale-up can be difficult. Mixing batches may provide a practical alternative when direct scale-up fails (the autonomous synthesis study). Transfer criteria therefore need experimental testing at each relevant scale.
Design the transfer experiment around variation
A useful scale-up plan identifies process variables that could alter chemical structure or morphology:
- Mixing: Does the larger vessel create concentration or temperature gradients?
- Addition sequence: Does local supersaturation or reaction rate change near the feed point?
- Heat removal: Does a different thermal profile alter nucleation, curing, or molecular weight?
- Purification: Does filtration, washing, or solvent exchange change surface chemistry?
- Drying and storage: Do residual solvent, moisture, or agglomeration alter the final state?
Record distributions, not only averages. A batch with the desired mean particle size can still fail if its upper tail contains agglomerates that generate defects. A formulation with acceptable average conductivity can fail when local network connectivity varies across the part. Metadata should capture sampling location, specimen preparation, instrument settings, batch identity, and conditioning, because those details determine whether results can be compared.
Give AI uncertainty something real to learn
AI models need process descriptors, specimen metadata, replicate results, and batch identifiers. They should distinguish interpolation from extrapolation. A prediction within a well-populated data region warrants different confidence from one involving a new chemistry, supplier, or production scale.
For cost and process planning, a structured guide to material cost estimating can connect formulation choices with manufacturing assumptions. Estimates become more useful when they include yield loss, rework, purification burden, quality testing, and scale-up risk, rather than raw material price alone.
The practical target is a decision system that identifies the next experiment most likely to reduce uncertainty and tests whether the resulting material transfers to the next process scale. That standard is more useful than predicting one apparently precise value from incomplete metadata.
Integrating Safety and Sustainability Metrics
Performance-only optimization creates late surprises. A material may deliver thermal stability, conductivity, strength, or barrier performance while introducing difficult exposure pathways, persistent fragments, problematic degradation products, or an impractical end-of-life route. Those issues belong in early formulation decisions because they are linked to chemical behavior, surface area, solubility, mobility, redox activity, and degradation rate.
The OECD's 2025 advanced-materials framework describes the European Commission's Safe and Sustainable by Design approach, considering novelty, exposure, severity, scope, immediacy, sustainability concerns, and regulatory applicability (OECD framework for advanced materials). This approach is useful because it treats safety and sustainability as design dimensions rather than a final compliance gate.
Measure the material people will encounter
Pristine laboratory material is rarely the only relevant form. A coating may weather, abrade, or release fragments. A polymer may encounter moisture, heat, oxygen, or recycling conditions. A nanomaterial may change surface chemistry during processing or use. The risk profile can therefore depend on transformation products and exposure conditions as much as nominal composition.
Add lifecycle questions to the property plan:
- Exposure: What forms can workers, users, or the environment encounter during manufacture, use, aging, recycling, or disposal?
- Persistence and transformation: Does the material remain stable, degrade, dissolve, oxidize, or fragment?
- Mobility: Can particles, dissolved species, additives, or degradation products move through relevant media?
- End of life: Can the material be separated, recycled, safely treated, or otherwise managed after use?
- Uncertainty: Which assumptions rely on pristine samples rather than aged or processed material?
A high-performing formulation may need redesign if the required additive, surface treatment, or processing aid creates disproportionate exposure or disposal complexity. Conversely, a material with slightly lower peak performance may be preferable if it supports safer handling and a credible end-of-life route.
Sustainability isn't a label applied after optimization. It is a constraint that changes which chemistry counts as viable.
Accelerating Discovery with Materials Informatics
Materials teams usually have the data needed for better decisions, but it sits in spreadsheets, ELNs, instrument exports, supplier documents, and personal notebooks. The first job isn't choosing an algorithm. It's creating a trusted connection between composition, process, structure, measurement conditions, and outcome.

Build an AI-ready property record
A useful record should contain:
- Material identity: Monomers, additives, fillers, catalysts, suppliers, lot identifiers, and composition.
- Process history: Mixing energy, temperature profile, residence time, curing or drying schedule, and scale.
- Structure descriptors: Molecular weight information, crystallinity, morphology, surface treatment, defects, and dispersion.
- Measurement metadata: Instrument, protocol, specimen conditioning, calibration, replicate count, and analysis convention.
- Outcome context: Target property, failure mode, acceptance threshold, and whether the result came from a laboratory, pilot, or production sample.
This structure lets models learn causal candidates rather than memorize labels. A prediction for viscosity should consider temperature, shear rate, solids content, molecular architecture, and dispersion. A conductivity model should account for network formation, filler orientation, moisture, thickness, and contact method.
The model should also expose uncertainty and comparable historical precedents. Explainability doesn't mean reducing every decision to a simple formula. It means showing which descriptors influenced the prediction, where the training data is sparse, and what experiment would test the leading hypothesis.
The following video provides additional context for using data and AI in scientific research:
Use AI to choose experiments, not replace judgment
A practical workflow starts with a defined target and known constraints. The team identifies the formulation space, excludes unsafe or unprocessable combinations, trains a model on harmonized historical data, and ranks experiments by expected information value. Scientists then test the recommendations, update the dataset, and challenge the model where predictions fail.
Polymerize is one example of an AI-native materials R&D platform that connects experimental data and applies domain-specific models to formulation and property development. The important evaluation criteria are broader than prediction accuracy. Check whether a system preserves metadata, handles missing values transparently, separates batches and scales, explains drivers, protects intellectual property, and fits the team's laboratory workflow.
AI won't repair inconsistent measurements by itself. It can, however, make hidden variation visible when the underlying records distinguish method, sample, process, and uncertainty.
Quick Reference and Cross-Reference Guide
When a formulation fails, start with the observed failure and work backward through the property chain. Don't immediately change the chemistry. First determine whether the failure is rooted in bulk composition, surface condition, thermal history, rheology, or scale-dependent structure.
| Field failure | First property questions | Likely measurement gap | Useful next action |
|---|---|---|---|
| Coating delamination | Did surface chemistry, wetting, or interfacial functionalization change? | Surface analysis, sampling location, cleaning history, or substrate condition | Compare failed and good regions with XPS, AES, or SIMS, then correlate with adhesion testing |
| Low-temperature brittleness | Was the transition measured using comparable conditioning and thermal history? | Tg method, moisture uptake, aging, or cooling rate | Harmonize DSC or DMA protocol and test conditioned specimens |
| Conductivity loss under humidity | Did moisture alter the conductive network or interface? | Environmental conditioning, film morphology, contact method, or dispersion state | Measure conductivity after controlled exposure and inspect network uniformity |
| Unexpected viscosity during processing | Does the flow curve match the actual shear and temperature profile? | Rheology protocol, solids content, residence time, or mixing history | Compare flow behavior under process-relevant conditions |
| Barrier failure | Is the surface treatment intact and is the bulk morphology uniform? | Depth profile, defects, agglomerates, or aging condition | Combine surface-sensitive chemistry with bulk thermal and morphological analysis |
| Batch-to-batch variability | Are average values hiding a wider structure distribution? | Replicate count, batch identity, particle distribution, or scale metadata | Store distributions and link each result to process history |
A disciplined troubleshooting sequence
Check the specimen first. Confirm whether the tested sample represents the production material, including drying, curing, aging, moisture, thickness, and storage. Many apparent chemistry failures begin as specimen mismatch.
Check the method next. Compare instrument, rate, frequency, atmosphere, conditioning, calibration, and analysis convention. A property difference may reflect protocol rather than material.
Check the interface. If the failure involves adhesion, wetting, corrosion, catalysis, or barrier performance, bulk composition alone is insufficient. Surface-sensitive analysis should be part of the investigation.
Check process distributions. Ask whether mixing, heat transfer, addition order, purification, drying, or dispersion changed at scale. Look beyond the mean and inspect local defects, agglomerates, and batch variation.
Then update the model. Add the failed result, its metadata, and the confirmed root cause. A failed experiment becomes valuable when the database records why it failed and which variables separated it from successful material.
For R&D leaders, the central operating principle is simple. Define chemical properties as measurements attached to structure, process, interface, method, and uncertainty. That definition gives scientists better experiments, gives process engineers more credible transfer criteria, and gives AI systems the context required to guide formulation rather than merely interpolate old numbers.
Polymerize helps materials teams connect composition, process history, characterization data, and formulation outcomes in one AI-ready R&D environment. Visit Polymerize to evaluate how structured metadata and explainable models can support more targeted experiments and more reliable scale-up decisions.
Put your R&D data to work
See how materials teams use Polymerize to plan fewer experiments and reach target properties faster.