

A formulation team has years of useful work, but the evidence is scattered across spreadsheets, ELN entries, batch records, test reports, and one senior chemist's memory. A new project arrives, the team searches by keywords, misses a relevant failed experiment, and starts again. The problem isn't a lack of data. It's the lack of explicit links between ingredients, formulations, processing conditions, measurements, suppliers, and outcomes.
A knowledge graph represents those links as connected entities and relationships. That lets scientists reuse experimental context instead of treating every record as an isolated document. The most established enterprise applications are foundational, including data harmonization, content integration, entity resolution, inventory management, data lineage, and identity management. These accounted for approximately 60% of primary use cases in a 2021 survey of 240 companies, according to this summary of knowledge graph industry findings.
The ten knowledge graph use cases below are ordered around an operating decision: which data must be connected first, which tactic is practical to test, and which failure mode can undermine the result. The same logic applies when evaluating top AI agent applications, especially when an agent must reason over evidence rather than retrieve similar text.
Table of Contents
- 1. Materials Property Prediction and Optimization
- 2. Formulation Scaling and Process Optimization
- 3. Regulatory Compliance and Safety Documentation
- 4. Intellectual Property Protection and Patent Intelligence
- 5. Supplier and Raw Material Qualification
- 6. Formulation Troubleshooting and Root Cause Analysis
- 7. Cross-Functional Research Collaboration and Knowledge Sharing
- 8. Accelerated Development of Sustainable and Green Materials
- 9. Predictive Maintenance and Degradation Monitoring
- 10. Customer Requirement Mapping and Rapid Specification Development
- 10 Knowledge Graph Use Cases Compared
- Choosing Your First Knowledge Graph Use Case
1. Materials Property Prediction and Optimization
Property prediction becomes useful when the graph connects composition, processing history, test method, measured property, and source experiment. A tensile-strength value without its formulation, cure profile, specimen preparation, and measurement context is difficult to reuse. The relationship is the valuable part.
For a polymer team, the first graph slice might connect resin family, molecular or compositional descriptors, additive package, mixing conditions, cure or cooling profile, and properties such as tensile strength, thermal stability, viscosity, or elongation. The model can then compare related experiments across projects and identify candidate formulations that resemble a target without pretending that similarity proves causation.
A practical first test is a blind prediction exercise. Select a product family with consistent data, hide known outcomes from the model, and ask whether it can rank plausible formulations or process conditions. Scientists should review the result for chemical validity, not just numerical fit.
Practical rule: A prediction should carry its evidence path. Show which experiments, materials, conditions, and measurements support the recommendation, and make uncertainty visible.
The failure mode is false confidence. A graph can connect records cleanly while preserving inconsistent units, missing test conditions, or duplicated material identities. Update it with every new result, including negative outcomes, and keep domain experts involved in interpreting predictions.
2. Formulation Scaling and Process Optimization
A bench formulation that works in a small vessel may fail when mixing, heat transfer, residence time, or addition order changes. The graph should connect lab formulation, scale, equipment, process parameters, batch genealogy, and quality outcome so scientists can compare like with like.
Start with one material family and document every scale-up attempt, including the unsuccessful ones. Link ingredient ratios to mixing speed, temperature profile, shear history, hold time, and observed defects. Production engineers can then distinguish a chemistry problem from a process-transfer problem.
The useful tactic is a scale-up playbook built from prior relationships. For example, if a formulation repeatedly develops viscosity drift after a change in mixing sequence, that pattern should be visible beside the relevant batches and test results. A digital twin may help model the process, but it won't compensate for incomplete or poorly contextualized historical records.
The graph is also a collaboration surface. Laboratory scientists need to record what changed between scales, while manufacturing teams need to capture equipment and operating context. Sensors can supply process data, but automated capture still needs validation and clear ownership.
The main failure mode is treating scale as a single variable. A pilot batch can differ from a lab batch through several interacting changes. If the graph stores only nominal temperature and batch size, it may hide the actual cause of a transfer failure.
A short video can help non-specialist stakeholders understand this connected process model:
3. Regulatory Compliance and Safety Documentation
Regulatory work depends on traceability. A formulation team must connect each ingredient and material identity to its region, regulatory status, concentration, hazard information, test evidence, supplier documentation, and approved use. A graph makes those relationships explicit instead of leaving them across separate compliance folders.
The first tactic is to model regulatory requirements as entities linked to ingredients, formulations, products, markets, and effective dates. Regulatory affairs can then answer a concrete question: which active formulations depend on a material whose status or permitted use has changed?
That structure can support technical dossiers, safety documentation, composition reviews, and audit trails. It can also connect a formulation decision to the underlying experiment and source document, which matters when a reviewer asks why a material was selected or excluded.
Auditability matters more than automation. A generated document is useful only when a reviewer can trace each important statement back to its source record.
The failure mode is allowing the graph to become an unofficial regulatory authority. External databases and supplier records can be incomplete, delayed, or interpreted differently across jurisdictions. The graph should preserve source, date, region, confidence, and reviewer status. It should also distinguish a confirmed restriction from an unresolved question.
Regulatory teams need to shape the ontology early. Scientists may think in terms of ingredients and performance, while compliance specialists think in terms of substance identity, reporting obligations, exposure, and jurisdiction. If those concepts aren't aligned, the graph will produce neat connections that don't support a defensible decision.
4. Intellectual Property Protection and Patent Intelligence
Patent intelligence is strongest when it links formulations, process steps, measured outcomes, inventors, laboratory records, publications, and external patent claims. A simple document search may find similar words, but it won't necessarily reveal that a particular additive, treatment sequence, and performance result form a potentially distinctive combination.
For an R&D team, the operating decision is whether to protect, publish, redesign, or investigate further. Connect proprietary experiments to their dates, contributors, materials, process conditions, and evidence. Keep unpublished formulations separate from public knowledge while preserving controlled links for authorized users.
A useful workflow begins during experimentation, not when counsel receives a final report. Scientists should record why a formulation was different, what alternative was rejected, and which result supports the claimed advantage. IP counsel can then review a structured history rather than reconstructing novelty from scattered notebooks.
The graph can also support freedom-to-operate work by connecting internal concepts to relevant patent families, assignees, jurisdictions, claims, and expiration information. It won't replace legal analysis. It can make the search space more coherent.
Protect the relationships, not just the recipe. A process sequence, material interaction, or narrow operating window may carry more inventive value than the ingredient list alone.
The failure mode is over-sharing. Apply role-based access, separate published and confidential nodes, log changes to ontology terms, and restrict paths that could expose sensitive formulations. A governance framework such as KG.GOV's approach to knowledge graphs and AI governance is relevant because ownership, provenance, access, and model behavior need to remain connected as the graph evolves.
5. Supplier and Raw Material Qualification
Raw materials vary by supplier, lot, grade, storage history, and specification interpretation. A graph should connect supplier, material identity, lot, certificate, measured attributes, formulation, process conditions, and final performance. That gives the team material genealogy instead of a supplier name attached to a purchase record.
Begin with a material that has caused variation or where dual sourcing matters. Standardize the test protocol, link each lot to the same performance measurements, and track results over time. A new supplier should not be judged only by whether its certificate matches the nominal specification. The graph should show how its material behaves in the actual formulation and process.
Failed or borderline qualification attempts matter here. If a resin passes identity testing but causes viscosity drift or poor aging performance, that result should remain linked to the lot and conditions. Deleting it creates a misleading history and makes repeated mistakes more likely.
Useful graph relationships include:
- Supplier to lot: Record source, manufacturing location, delivery, storage, and certificate details.
- Lot to measurement: Preserve test method, instrument, operator context, units, and date.
- Material to formulation: Show where a grade or lot was used and at what loading.
- Formulation to outcome: Link performance, defect, release status, and customer application.
The failure mode is confusing specification compliance with formulation equivalence. A supplier scorecard should include performance in context, not just paperwork. Procurement, quality, and R&D must agree on tolerance bands and escalation rules before the graph starts driving qualification decisions.
6. Formulation Troubleshooting and Root Cause Analysis
A failed batch rarely has one obvious cause. The graph needs to connect raw material lots, formulation versions, operator actions, equipment state, environmental conditions, process history, test results, and failure descriptions. That allows investigators to follow the path from an observed defect back through the decisions and conditions that produced it.
Take an adhesive batch with poor tack. The relevant path may include a supplier lot, moisture exposure, a changed mixing sequence, a temperature excursion, and an aging result. A keyword search might find “tack” in several reports. A graph can narrow the investigation to the combinations that share the same material, process event, or environmental condition.
The first tactic is a failure library with structured context. Capture what operators saw, what they changed, what tests confirmed, and which suspected causes were ruled out. Field complaints should flow back into the same model, linked to application, customer conditions, production batch, and retained samples.
A failure record without conditions is a story, not evidence. Preserve the batch, instrument, environment, process state, and test method before drawing conclusions.
Statistical pattern recognition can help surface non-obvious relationships, but correlation isn't a root cause. Investigators still need controlled follow-up experiments. The failure mode is converting a plausible graph path into a confirmed explanation without testing it.
7. Cross-Functional Research Collaboration and Knowledge Sharing
Global R&D teams often repeat work because researchers can't find the right precedent or can't interpret it without the original author. A shared graph connects scientists, sites, projects, materials, methods, formulations, experiments, results, and technical decisions so teams can discover relevant work with its context intact.
The operating decision is what to reuse, what to repeat, and what to challenge. A scientist developing a coating should be able to find related formulations from another site, see the process conditions, understand the test method, and identify whether the result was reliable, inconclusive, or unsuccessful.
Start with a shared vocabulary for material classes, properties, test methods, and failure modes. The zbMATH Open Knowledge Graph example shows how a graph can connect publications, people, concepts, organizations, and evidence across a historical record exceeding 250 years, with more than 34.5 million entities and nearly 170 million relationships. Those figures describe a scientific knowledge graph, not a materials deployment target, but the structure illustrates why relational context remains reusable over time.
Access control must match the collaboration model. Some findings can be shared across sites, while recipes, customer projects, and patent-sensitive work require narrower permissions. The failure mode is either excessive openness or excessive restriction. A graph that hides everything produces silos, while one that exposes confidential paths creates unacceptable IP risk.
8. Accelerated Development of Sustainable and Green Materials
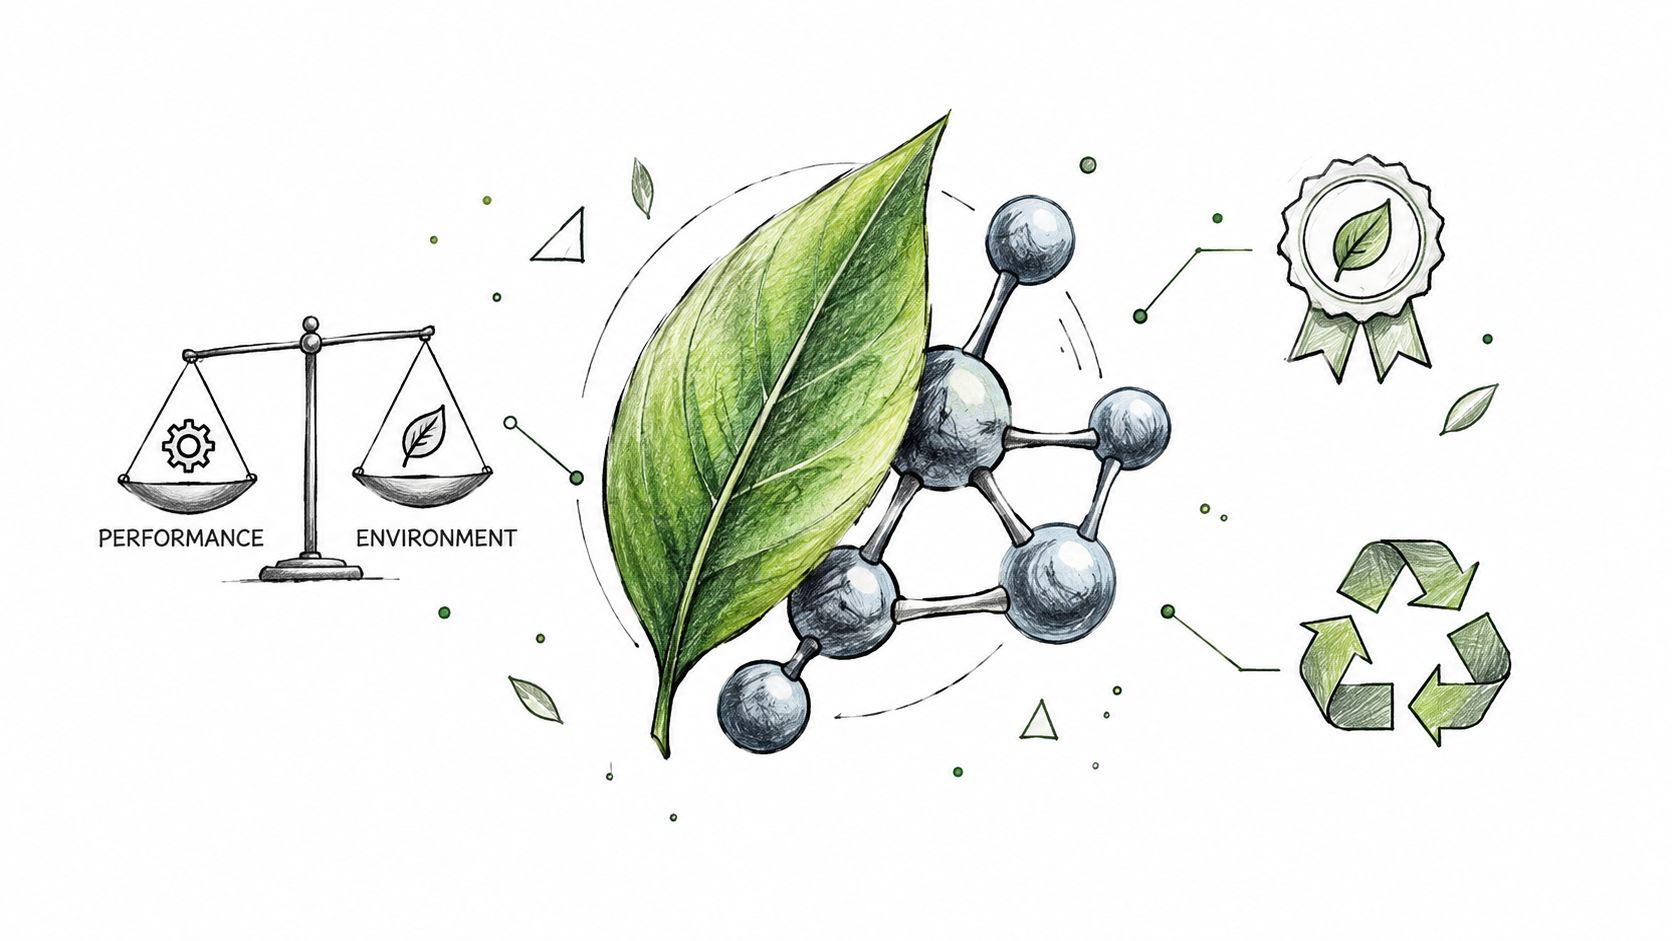
Sustainability decisions become difficult when environmental attributes sit apart from performance data. A useful graph connects raw material origin, production route, hazard profile, environmental assessment, formulation, process energy, durability, and end-use requirement.
For example, a team replacing a solvent or petroleum-derived component needs more than a list of alternatives. It must know whether the substitute meets viscosity, adhesion, cure, shelf-life, safety, and supply requirements. The graph should make those trade-offs visible rather than labeling one candidate “green” without context.
Start with one application where the performance specification is clear. Add controlled environmental attributes and link them to the source, method, boundary, and assumptions. Sustainability specialists should review the model because environmental data can be sensitive to geography, production route, allocation method, and use phase.
A practical decision view can rank candidates by performance fit and environmental constraints:
- Performance fit: Which required properties does the candidate meet?
- Material risk: Is the supply base stable, qualified, and traceable?
- Process impact: Does the substitute require different energy, equipment, or handling?
- Evidence quality: Are the environmental and technical measurements comparable?
The failure mode is optimizing a single metric. A lower-impact ingredient that shortens service life may shift the burden elsewhere. Another risk is treating supplier claims as directly comparable when their methods differ. Preserve provenance and uncertainty for every sustainability relationship.
9. Predictive Maintenance and Degradation Monitoring
Material degradation is a time-dependent relationship between composition, processing history, exposure, and performance loss. The graph should connect formulation, batch, stabilizer package, storage condition, field environment, exposure duration, degradation mechanism, and measured property.
A coatings team may need to understand why two visually similar products weather differently. The answer could involve pigment, film thickness, cure conditions, substrate, humidity, light exposure, or a stabilizer interaction. A graph preserves those connections across accelerated aging studies and real-world field observations.
The first tactic is to standardize degradation studies and link every result to its exposure conditions. Accelerated aging can generate useful evidence, but it only helps when the relationship between accelerated and real-world conditions is understood. Customer feedback and field testing should feed back into the same material and batch history.
A graph can support predictions about shelf-life, storage conditions, stabilizer choices, and inspection priorities. It can also expose where evidence is weak. If a prediction relies on a related formulation tested under a different humidity range, the recommendation should say so.
The failure mode is treating degradation as a property of the material alone. It's often a property of the material, process, environment, geometry, and time together. Missing any of those links can produce a confident but unsafe estimate. Keep validation studies connected to the predictions they are meant to test.
10. Customer Requirement Mapping and Rapid Specification Development
Customer requests arrive in application language. “Better heat resistance,” “lower odor,” or “stable during outdoor use” must become measurable technical requirements, test methods, acceptable ranges, and development decisions. A knowledge graph connects customer requirement, application, specification, material property, formulation, process window, test evidence, and prior product.
The operating decision is whether an existing formulation is close enough to adapt, or whether the request needs a new development program. A specialty chemical supplier can compare a customer's requirements with known formulations and show which properties already meet target ranges, which need confirmation, and which require reformulation.
Start by standardizing requirement templates for common markets. Connect sales terminology to technical concepts, but don't let an automated translation become the final specification. Scientists and application engineers should review the mapping, especially where a customer phrase has several possible test interpretations.
A useful internal view shows:
- Matched requirements: Properties already supported by relevant evidence.
- Unverified requirements: Properties that may fit but lack the right test method or application context.
- Development gaps: Requirements that need formulation, process, or testing work.
- Commercial constraints: Supplier availability, regulatory status, confidentiality, and expected scale.
The failure mode is promising feasibility based on semantic similarity. Two formulations may look close in composition but behave differently under the customer's process or substrate. Preserve the evidence path and state what still needs testing before a quote becomes a commitment.
10 Knowledge Graph Use Cases Compared
| Use case | Implementation complexity 🔄 | Resource requirements ⚡ | Expected outcomes 📊⭐ | Ideal use cases 💡 | Key advantages ⭐ |
|---|---|---|---|---|---|
| Materials Property Prediction and Optimization | 🔄 High, large-scale ETL, model training and validation | ⚡ High, compute, data engineers, ML & domain experts | 📊 Fewer failed experiments (~50%); ⭐ faster formulation cycles | 💡 New material screening; formulation R&D | ⭐ Predictive insights across historic experiments; improved R&D ROI |
| Formulation Scaling and Process Optimization | 🔄 High, capture non-linear scale effects and equipment differences | ⚡ High, MES/IoT integration, pilot data, simulation tools | 📊 Reduced scale-up failures; ⭐ improved first-pass yields | 💡 Bench-to-manufacturing transfers; pilot optimization | ⭐ Faster production readiness; lower pilot/failure costs |
| Regulatory Compliance and Safety Documentation | 🔄 Medium–High, map regulations to data and maintain updates | ⚡ Medium, regulatory DBs, legal/regulatory experts, maintenance | 📊 Faster dossier generation; ⭐ lower regulatory rejection risk | 💡 Global registrations, safety data sheet automation | ⭐ Automated compliance checks and auditable traceability |
| Intellectual Property Protection and Patent Intelligence | 🔄 Medium, link experiments to patents and manage access controls | ⚡ Medium, patent databases, IP counsel, monitoring tools | 📊 Better patentability discovery; ⭐ clearer FTO insights | 💡 Patent landscaping; prosecution support | ⭐ Data-backed claims and protected trade secrets |
| Supplier and Raw Material Qualification | 🔄 Medium, supplier data ingestion, lot-level genealogy tracking | ⚡ Medium, supplier testing, long-term lot data, cooperation | 📊 Faster qualification; ⭐ improved traceability & risk analysis | 💡 Supplier changes, dual-sourcing qualification | ⭐ Quicker supplier validation; stronger supply resilience |
| Formulation Troubleshooting and Root Cause Analysis | 🔄 High, multi-factor causal analysis and comprehensive capture | ⚡ Medium–High, real-time capture, historical case libraries | 📊 Reduced troubleshooting time (weeks→days); ⭐ prevent recurrence | 💡 Production failures; field performance issues | ⭐ Rapid RCA, knowledge retention, reduced scrap |
| Cross-Functional Research Collaboration and Knowledge Sharing | 🔄 Medium, governance, federated access, cultural change | ⚡ Low–Medium, platform setup, access controls, change mgmt | 📊 Less duplication; ⭐ accelerated cross-team innovation | 💡 Multi-site R&D, consortia and partnerships | ⭐ Centralized discovery; faster onboarding and shared learnings |
| Accelerated Development of Sustainable and Green Materials | 🔄 Medium, integrate LCA and evolving sustainability criteria | ⚡ Medium, environmental databases, sustainability expertise | 📊 Faster substitution of high-impact materials; ⭐ transparent claims | 💡 ESG initiatives; low‑VOC/ bio-based material development | ⭐ Data-driven sustainability trade-offs; supports regulatory/market demands |
| Predictive Maintenance and Degradation Monitoring | 🔄 Medium, long-term aging models and multi-factor data capture | ⚡ Medium, stability studies, field monitoring, modeling | 📊 Predictive shelf-life estimates; ⭐ reduced field failures & warranties | 💡 Durability forecasting; shelf-life claims | ⭐ Proactive quality control; optimized stabilizer strategies |
| Customer Requirement Mapping and Rapid Specification Development | 🔄 Low–Medium, map customer language to technical specs and templates | ⚡ Low, templates, sales–R&D alignment, translation rules | 📊 Faster spec development; ⭐ improved quote-to-delivery times | 💡 Custom orders, rapid feasibility assessments for customers | ⭐ Speeds responsiveness to customers; clearer development effort estimates |
Choosing Your First Knowledge Graph Use Case
The best starting point isn't the most impressive use case. Rank the options against three questions.
Which use case already has connected data? Supplier qualification, troubleshooting, and property prediction often have strong starting records because teams already collect formulations, lots, batches, tests, and outcomes. Collaboration and customer mapping may need more work on terminology and permissions. Regulatory and IP use cases can be valuable, but they require careful governance before broad access.
Which bottleneck costs the team the most? If scientists repeat failed experiments, start with formulation history, failure analysis, and property prediction. If scale-up causes late surprises, connect lab and production records first. If customer requests stall commercial work, map requirements to existing formulations and test evidence. The graph should change a decision that currently consumes time, creates risk, or causes avoidable laboratory work.
Which use case can run on one product family within one quarter? Choose a narrow boundary. One polymer family, one test workflow, one plant, or one customer application gives the team a manageable ontology and a clear validation set. Avoid an enterprise-wide graph that tries to unify every material, system, and process before anyone trusts the first result.
A sensible priority order is:
- Troubleshooting, if failure records and batch context already exist.
- Supplier qualification, if raw material lots and performance tests are well tracked.
- Property prediction, if experiments have consistent methods and sufficient context.
- Scale-up, if lab and production data can be connected.
- Customer requirement mapping, if commercial and technical teams share clear specifications.
- Degradation monitoring, if aging and field records are available.
- Sustainability development, once environmental data has reliable provenance.
- Regulatory documentation, when regional status and source records are governed.
- Patent intelligence, when confidentiality and legal review are designed into the model.
- Cross-functional collaboration, as a broader layer that can expand after core records are trusted.
This ranking isn't universal. The right choice depends on the data you can access and the decision you need to improve. A scientific knowledge graph can be rigorous when it represents explicit entities, relationships, queries, and evidence. The SciQA benchmark illustrates that approach with nearly 170,000 resources, contributions from almost 15,000 scholarly articles, 709 research fields, 100 manually authored questions, and 2,465 automatically generated questions. The lesson for materials R&D is practical: define relationships clearly enough that answers can be audited, not merely phrased convincingly.
Start with a controlled product family, validate predictions against blind samples, and preserve failed experiments rather than filtering them out. The 2025 study described by the National Institute for Computational Data evaluated graph-enhanced retrieval on 510 complex questions and reported an 80% improvement in answer truthfulness, more than doubling the number answered correctly while using about 10% more tokens. Its important implementation lesson is that even a relatively simple document-structure graph can create value before a company builds an elaborate ontology.
For materials teams, trust comes from provenance. Link every recommendation to the formulation, ingredient, batch, process, test method, result, and source document that support it. Add confidence, permissions, contradiction handling, and update ownership before expanding to more sites or material classes.
Polymerize is one relevant option for this operating model. Its platform connects experiments, formulations, samples, batches, synthesis processes, test results, and property measurements into a centralized data backbone, while Polymerize Labs adds explainable models and confidence scores for materials decisions. Teams evaluating it should still begin with a narrow product-family pilot and judge the system by whether scientists can make better-supported next-experiment decisions.
Polymerize helps materials R&D teams connect fragmented spreadsheet, ELN, formulation, and test data so knowledge graph relationships can support property prediction, troubleshooting, scale-up, and experiment planning. Explore Polymerize to see how its AI-native platform can turn disconnected records into traceable, decision-ready materials intelligence.
Put your R&D data to work
See how materials teams use Polymerize to plan fewer experiments and reach target properties faster.